Tue 23rd Sept
It was a bad day at the office for the Aussie stock market yesterday. The ASX 200 fell over 70 points to close down by 1.29%. A weak lead from Wall Street and a continuing slide for Iron Ore and commodity prices hitting our market where it hurt. A Prime Minister banging war drums, more talk about further falls for the AUD and still no budget adding to an already nervous market. The usual jubilant chant of ‘Aussie, Aussie, Aussie, Oi, Oi Oi’ was somewhat modified for yesterday.
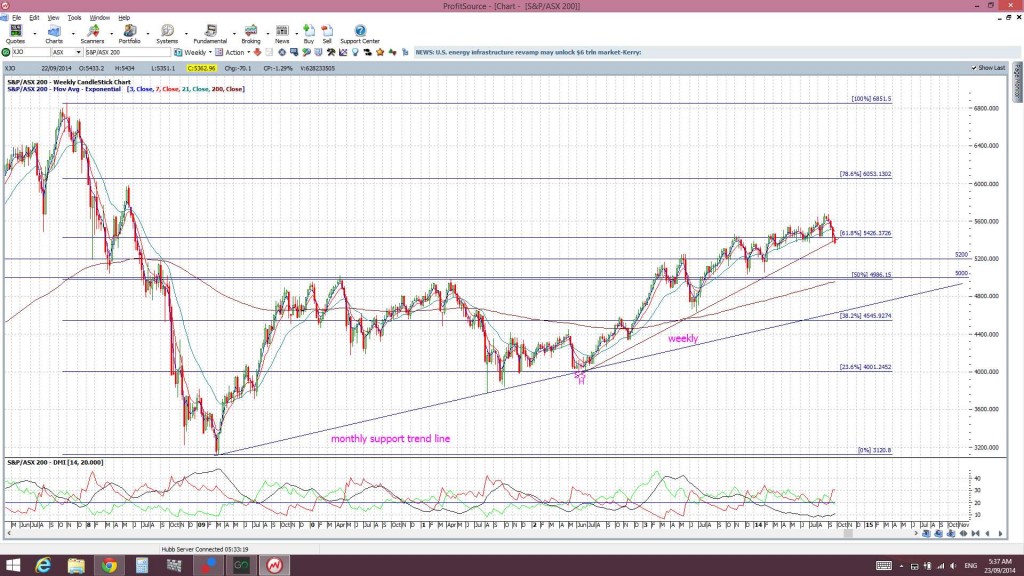
Mention was made yesterday about a breach of a weekly support trend line on the ASX200 and that certainly was the case BUT traders need to wait and see the weekly candle close before a break of this trend line can be confirmed:
ASX200 weekly: XJO: a weekly support tend line is being tested.
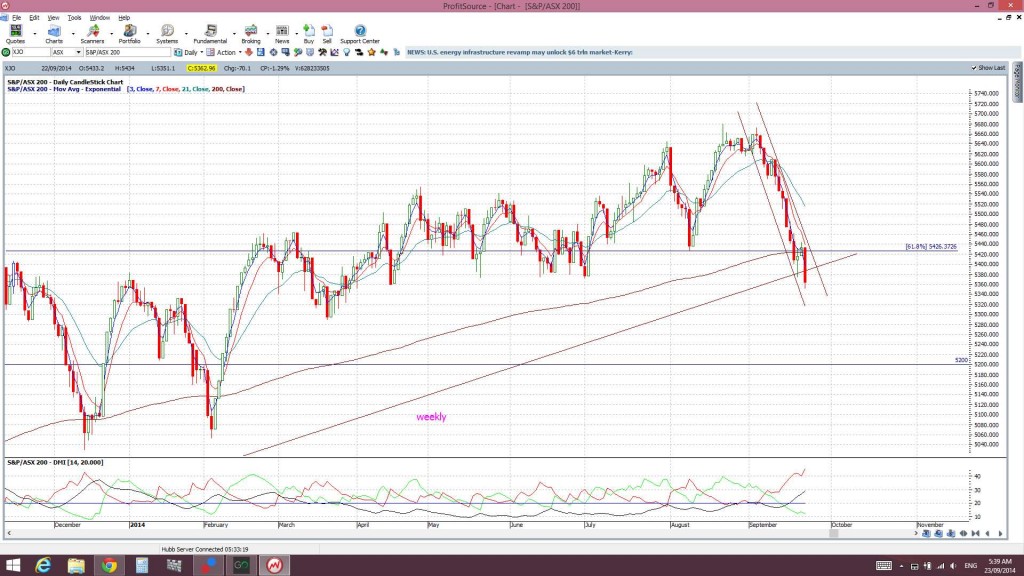
Regular readers of this blog will probably know the cautionary note I am going to spell out now. I have seen many a weekly trend line confirmed broken only to find price consolidate within a flag pattern and, then, rally higher. The ASX200 is currently pulling back and testing the weekly support trend line but, for now, price is consolidating within a descending trading channel or ‘Flag’ pattern as well. Now, I’m not predicting that this ASX200 channel will evolve as a ‘Bull Flag’ BUT I urge traders to wait to see a confirmation of any breakout from the trading channel, bullish or bearish, before taking any further directional trades on the ASX200:
ASX200 daily: XJO: showing ‘Flag’ pattern forming:
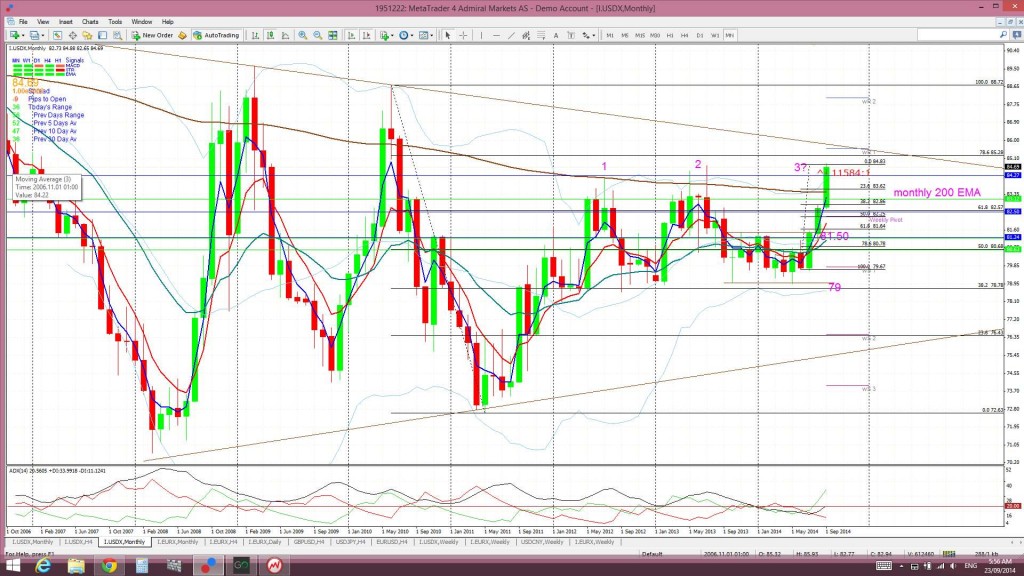
The USD index continues to play its part here too. The stronger USD has put a lot of pressure on commodity prices (coal, gold, silver etc) which, in turn, has impacted our market but this index is currently waging its own battle and struggling to break above major resistance:
USDX monthly: struggling at major resistance from a 78.6% fib and a monthly trend line:
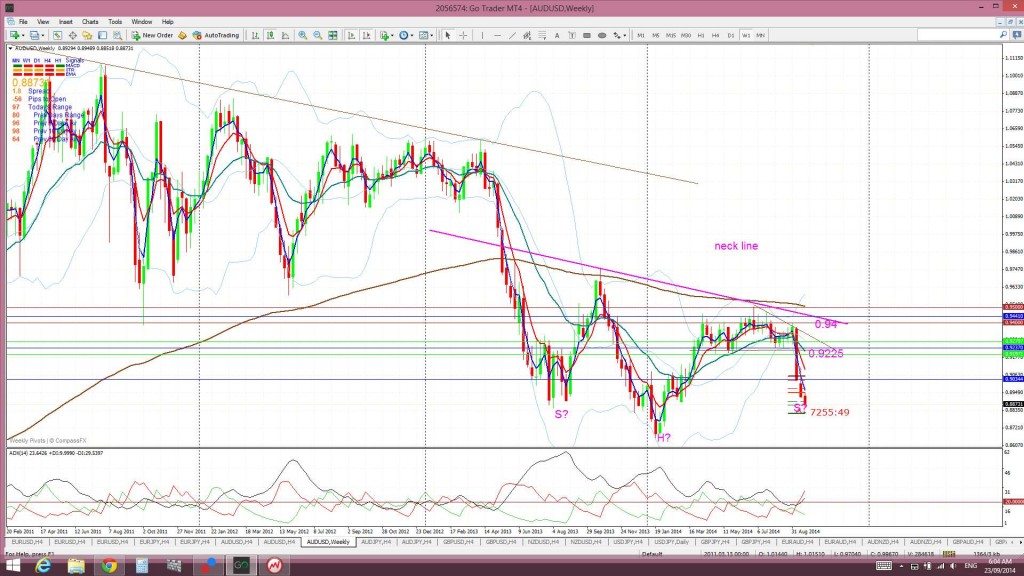
A bullish breakout on the USDX would most likely add to the Aussie market pain but any reversal here could see a turn in fortune for commodity prices. I would like to see a reversal on the USDX so as to help form up the bullish ‘inverse H&S’ pattern I’m currently seeing on the A/U weekly chart!
Summary:
- The ASX200 is testing a weekly support trend line.
- Price action is currently forming a descending trading channel or ‘Flag’ pattern. Traders need to watch trend lines here to confirm either a bullish or bearish breakout.
- Traders need to see a weekly candle close below the weekly trend line to confirm a bearish breakdown.
- Traders need to track the USD continues to monitor the impact on commodity prices.


