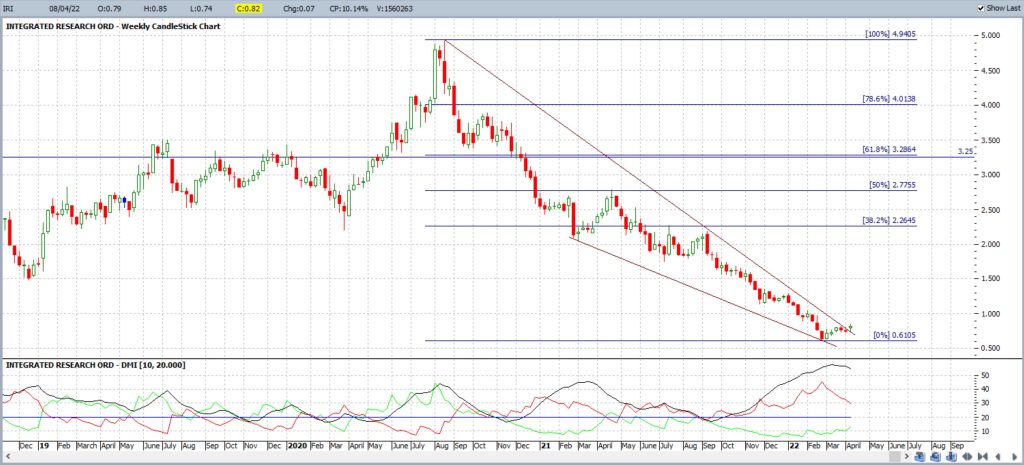
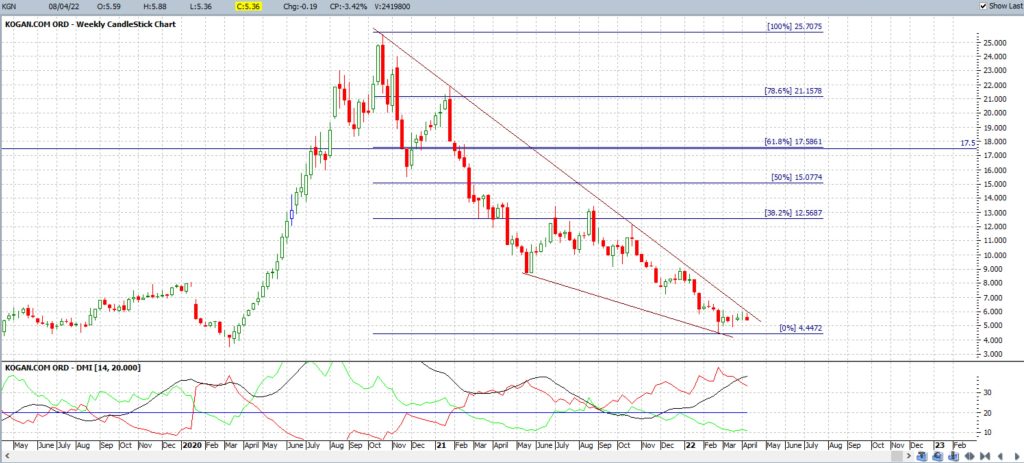
Like many other global stock indices, the ASX 200 has spent the last few months in a period of sideways consolidation following the print of a recent all-time high. I have been saying, for many months now, that I expected the ASX 200 to chop around either side of the key 7,200 level until after the 2022 Australian Federal Election. Looking back, it is clear to see that this analysis has been pretty spot on.
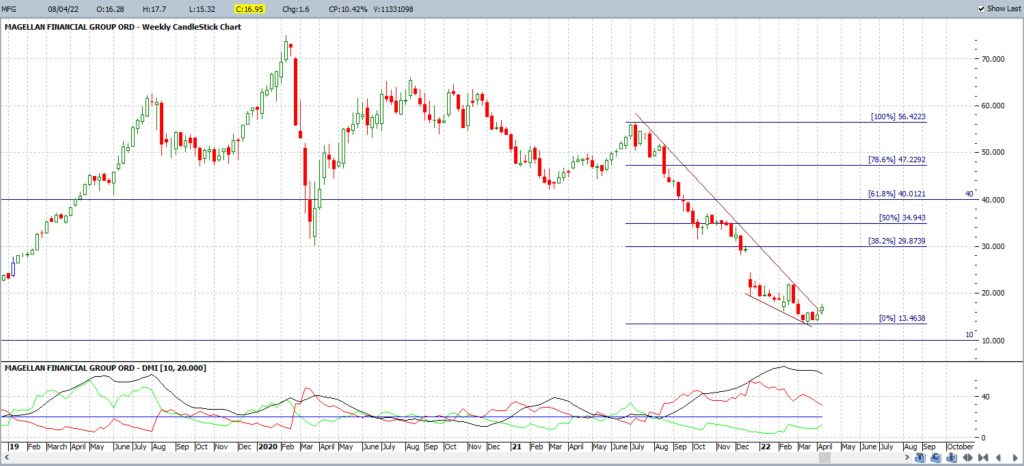
At the time of writing this article we are still waiting for the Australian Prime Minister to call the date of the Federal election. However, this will be held sometime in May and it is after that that I would expect our major stock market index might be able to break free of this consolidation phase. There are a number of stocks that have pulled back significantly from their all-time highs and these are my preferred technical setup‘s to monitor for potential trading opportunity. I like to look for stocks that have pulled back, preferably in descending wedge style patterns, and that form a base before embarking on any new ADX momentum-based upward trajectory. The ASX stocks discussed in this article are just some that I have my eye on as we wait to see which political party will be successful in the coming election.
XJO: ASX-200
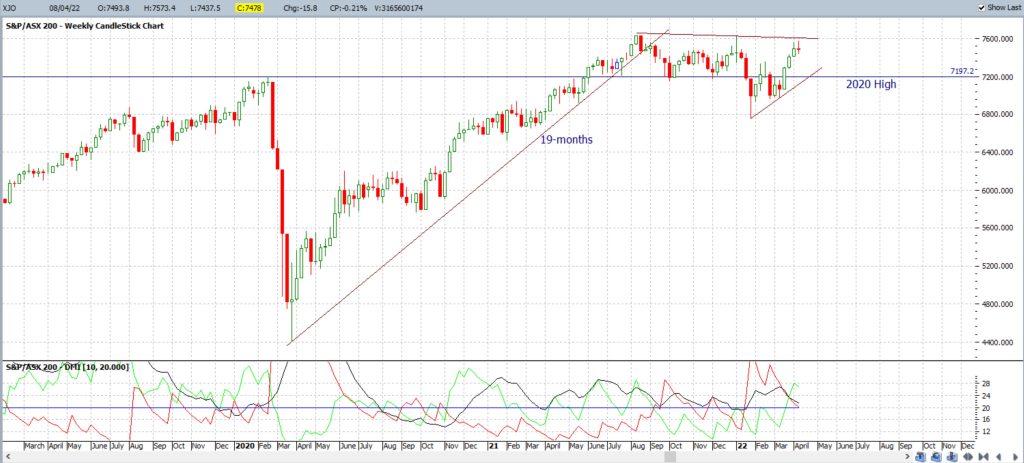
The weekly chart of the ASX-200 is shown in Figure 1 and note how the all-time high, of 7,632.80, was printed back in August 2021. Price action has essentially chopped sideways since then, either side of the whole-number 7,200 region, as this is near the previous all-time High of 7,197.20 printed just prior to the onslaught of Covid-19.
I have noted for many months, across different forums, that I expected the XJO index to chop sideways around this key and psychological 7,200 level until after the 2022 Australian Federal Election and this is exactly what has evolved! Old ‘Resistance’ levels, such as this 7,200 region on the XJO, are often tested on multiple occasions before evolving into any potential new ‘Support’.
Traders should watch for any new momentum-based trend line breakout following the election and I do note that this chart displays a bit of a Bull Flag appearance! ‘Bull Flags’ are bullish continuation patterns so this is a bit of a technical reason to harbour some optimism here!
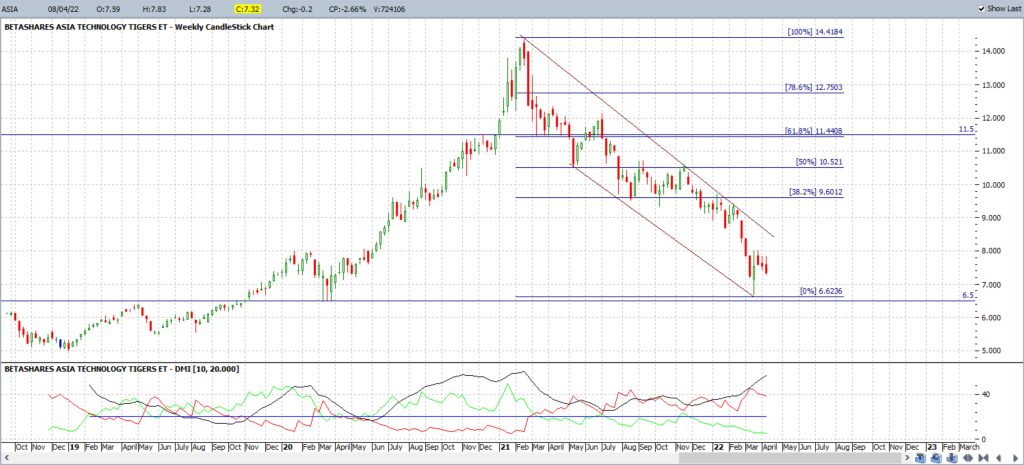
ASIA: ASIA Technology ETF
Figure 7: MFG weekly
Concluding comments
Like the overall market index XJO, plenty of ASX stocks have pulled back from their all-time high levels. Many Technical Analysts enjoy this type of price action as it can enable trades to be entered at a discounted price. Watching for momentum-based trend line breakouts is just one way to select new trading opportunities and six different ASX stocks have been suggested in this article as being worth monitoring. As always, traders should only ever trade with funds that are surplus to their needs and that they can afford to lose. Trading is a high-risk activity and trading risk, measuring the amount of funds that can be lost on a trade, should be carefully managed. Traders should seek financial advice before engaging in any trading activity.


