


I have been away for the last 5 weeks so have not been charting as frequently about stocks and or stock indices. Like all stock markets over recent weeks though, the Aussie market has also been under pressure but closed higher today after some decent AUD Employment data. Here is how I’m seeing the charts of the ASX-200 / XJO with some note about levels I consider worth monitoring.
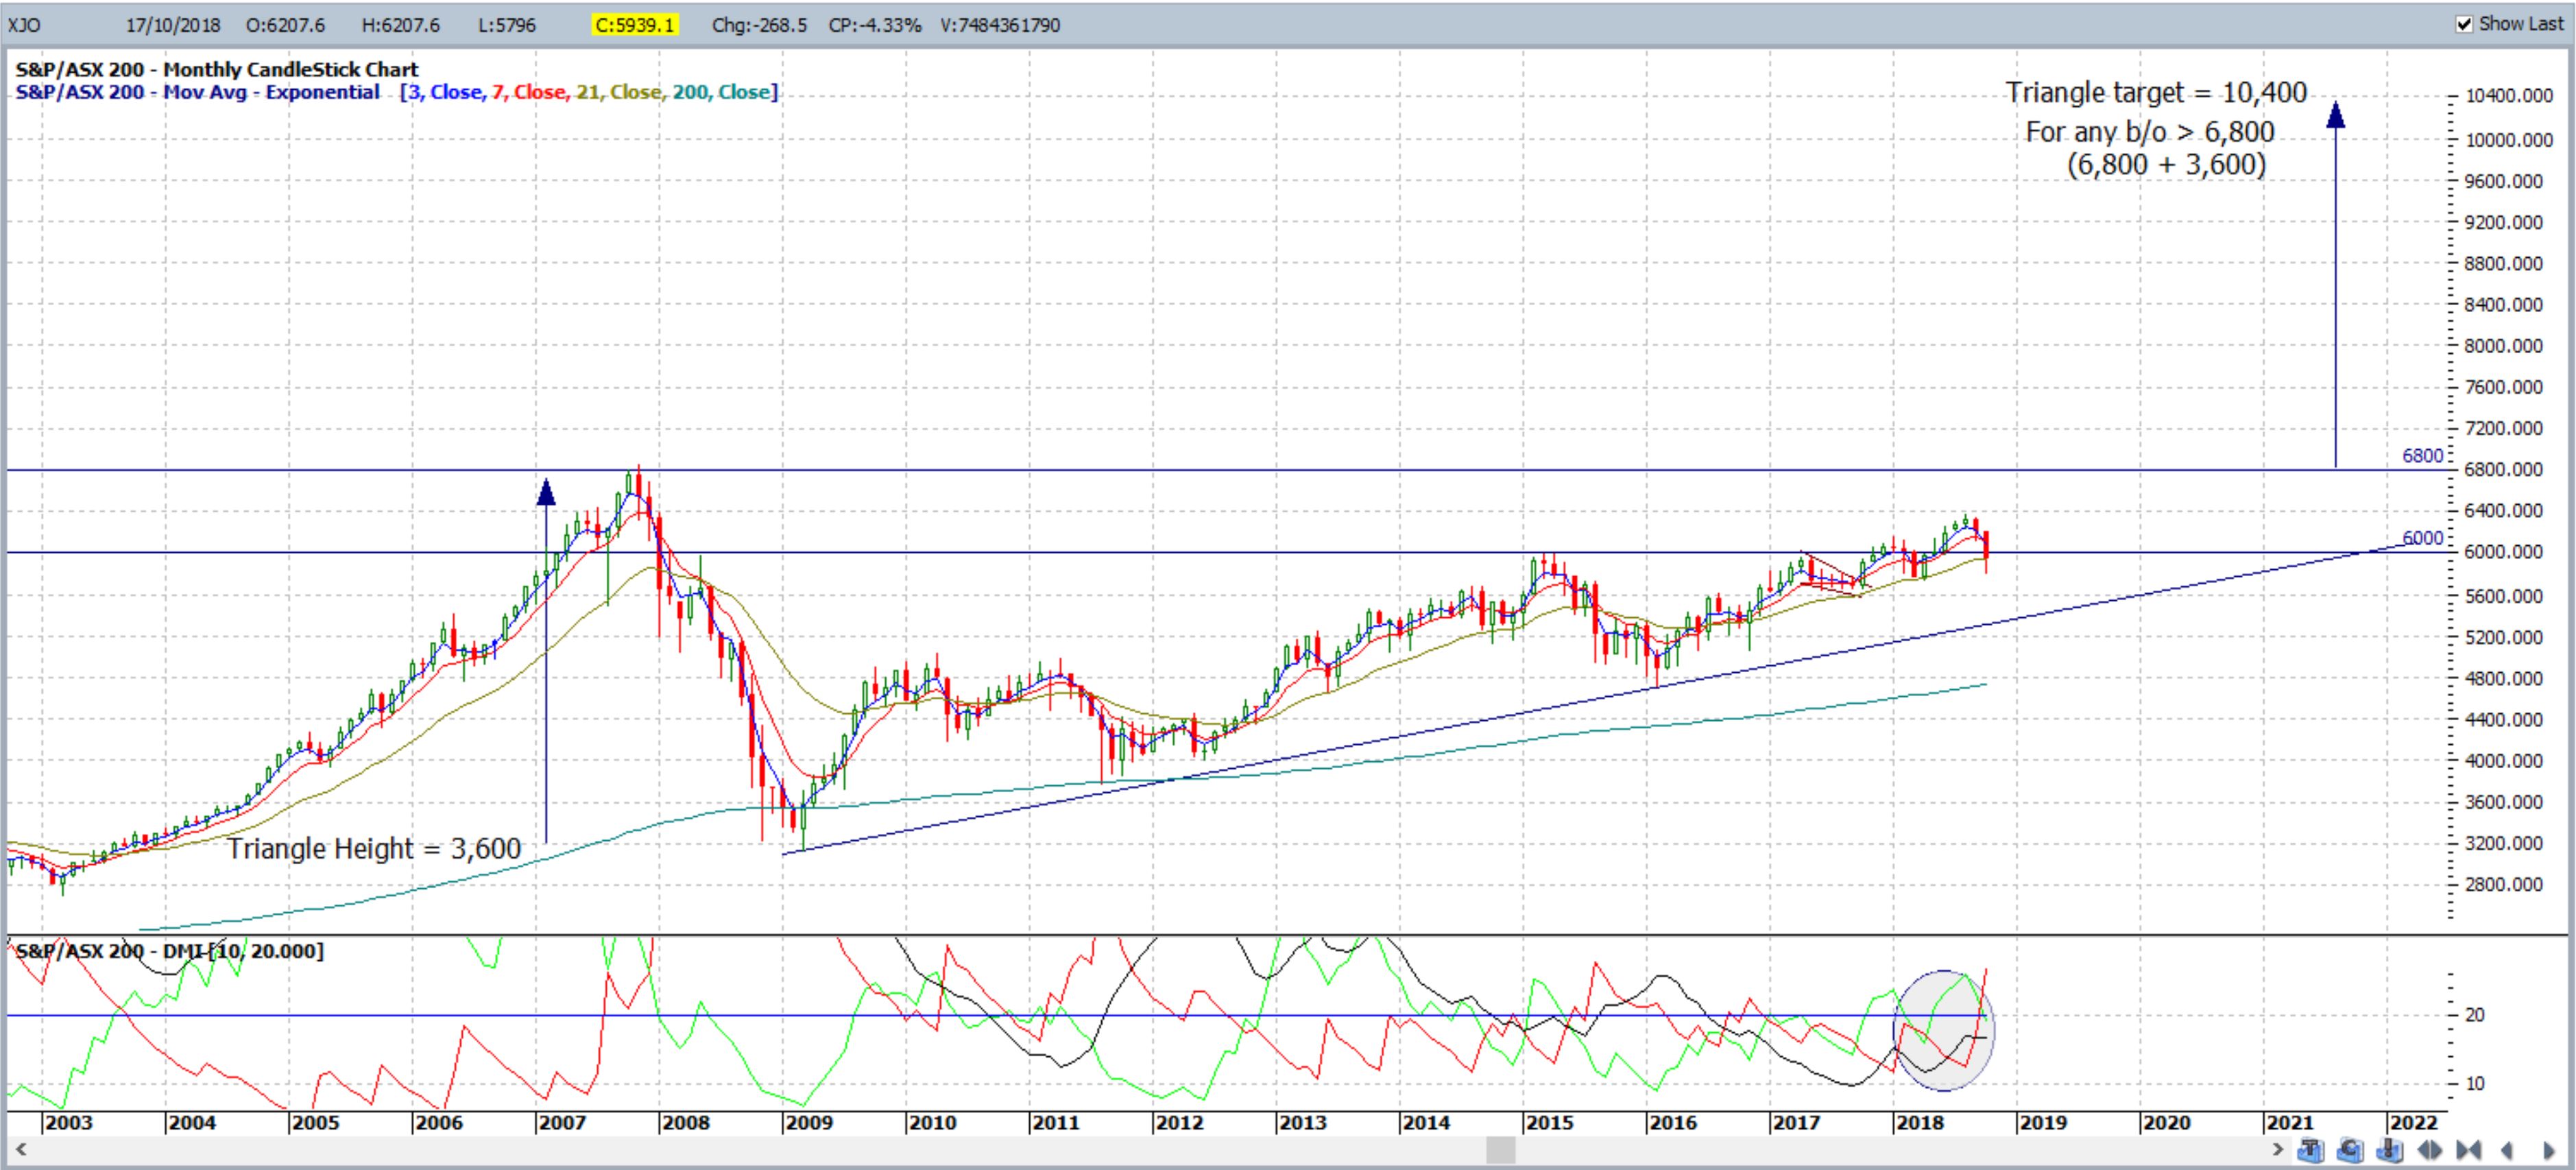
XJO monthly / ASX-200: The uptrend since 2009 is still intact. Note that, whilst bearish momentum is above the threshold 20 level, the ADX is still below 20. Longer term, the 6,800 level remains the one to break but the 6,000 level is the S/R region in current focus:
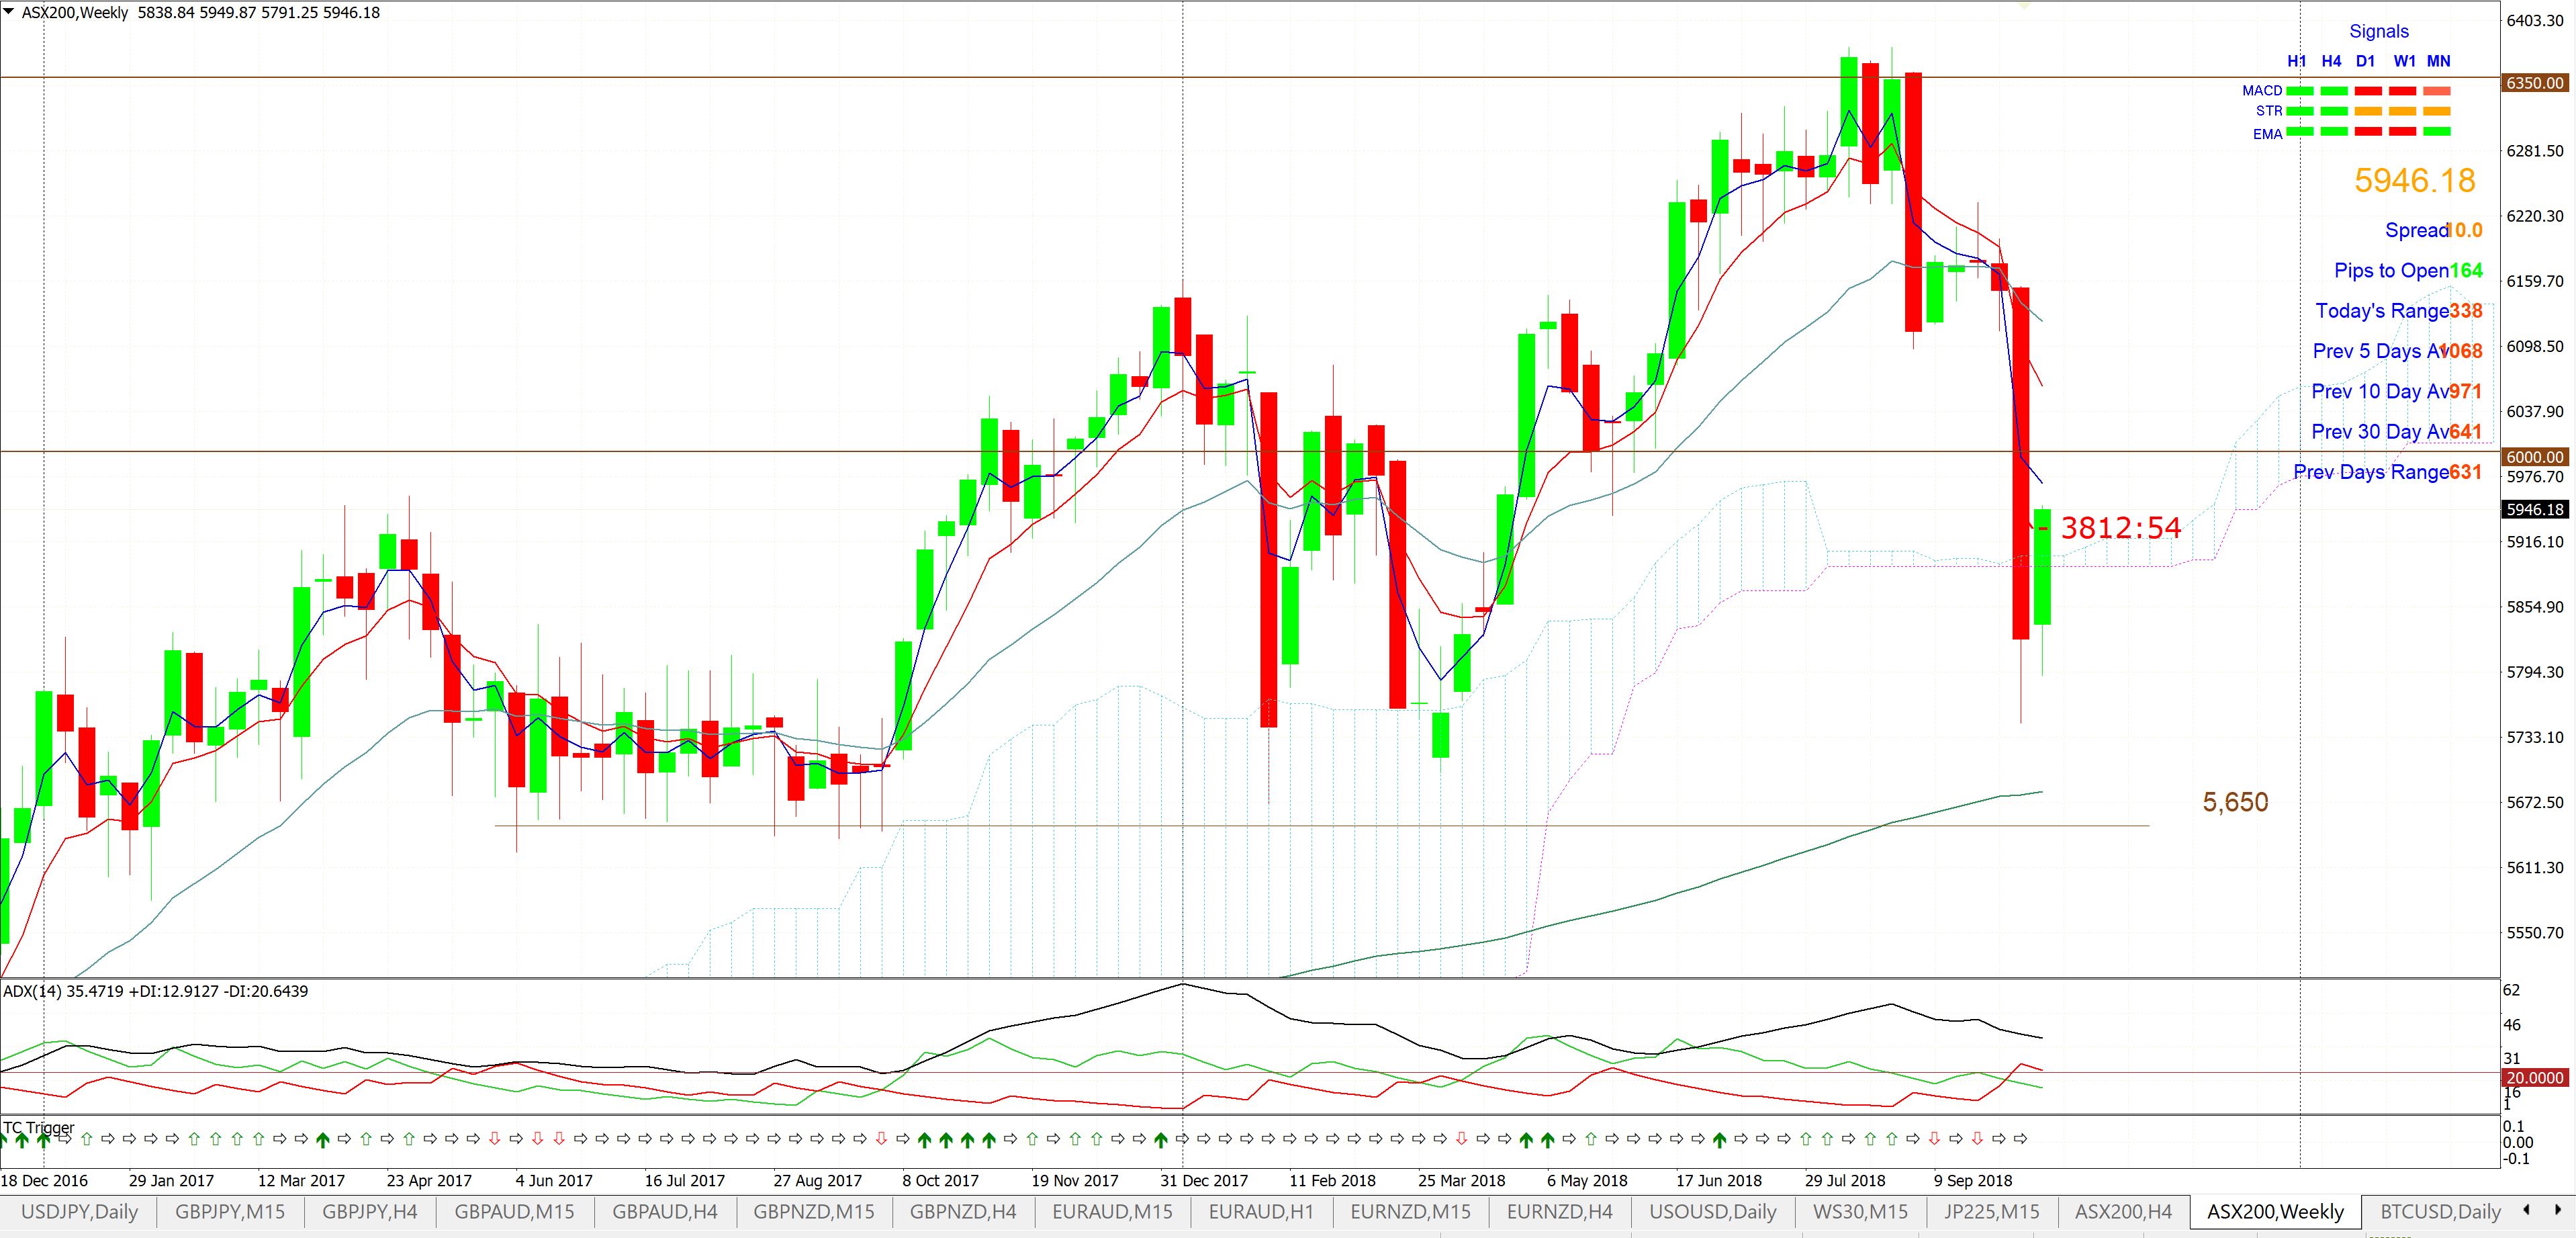
ASX-200 weekly: Overall, price action is still in an uptrend since the 2009 Lows; there is a pattern of higher Highs and higher Lows that remains intact and there is a support trend line that has not been broken. The expanded chart shows that the current weekly candle is currently an indecision-style ‘Inside’ candle following last week’s large bearish candle. The 6,000 level is a major psychological level and a weekly close back above this region would be a rather bullish achievement.

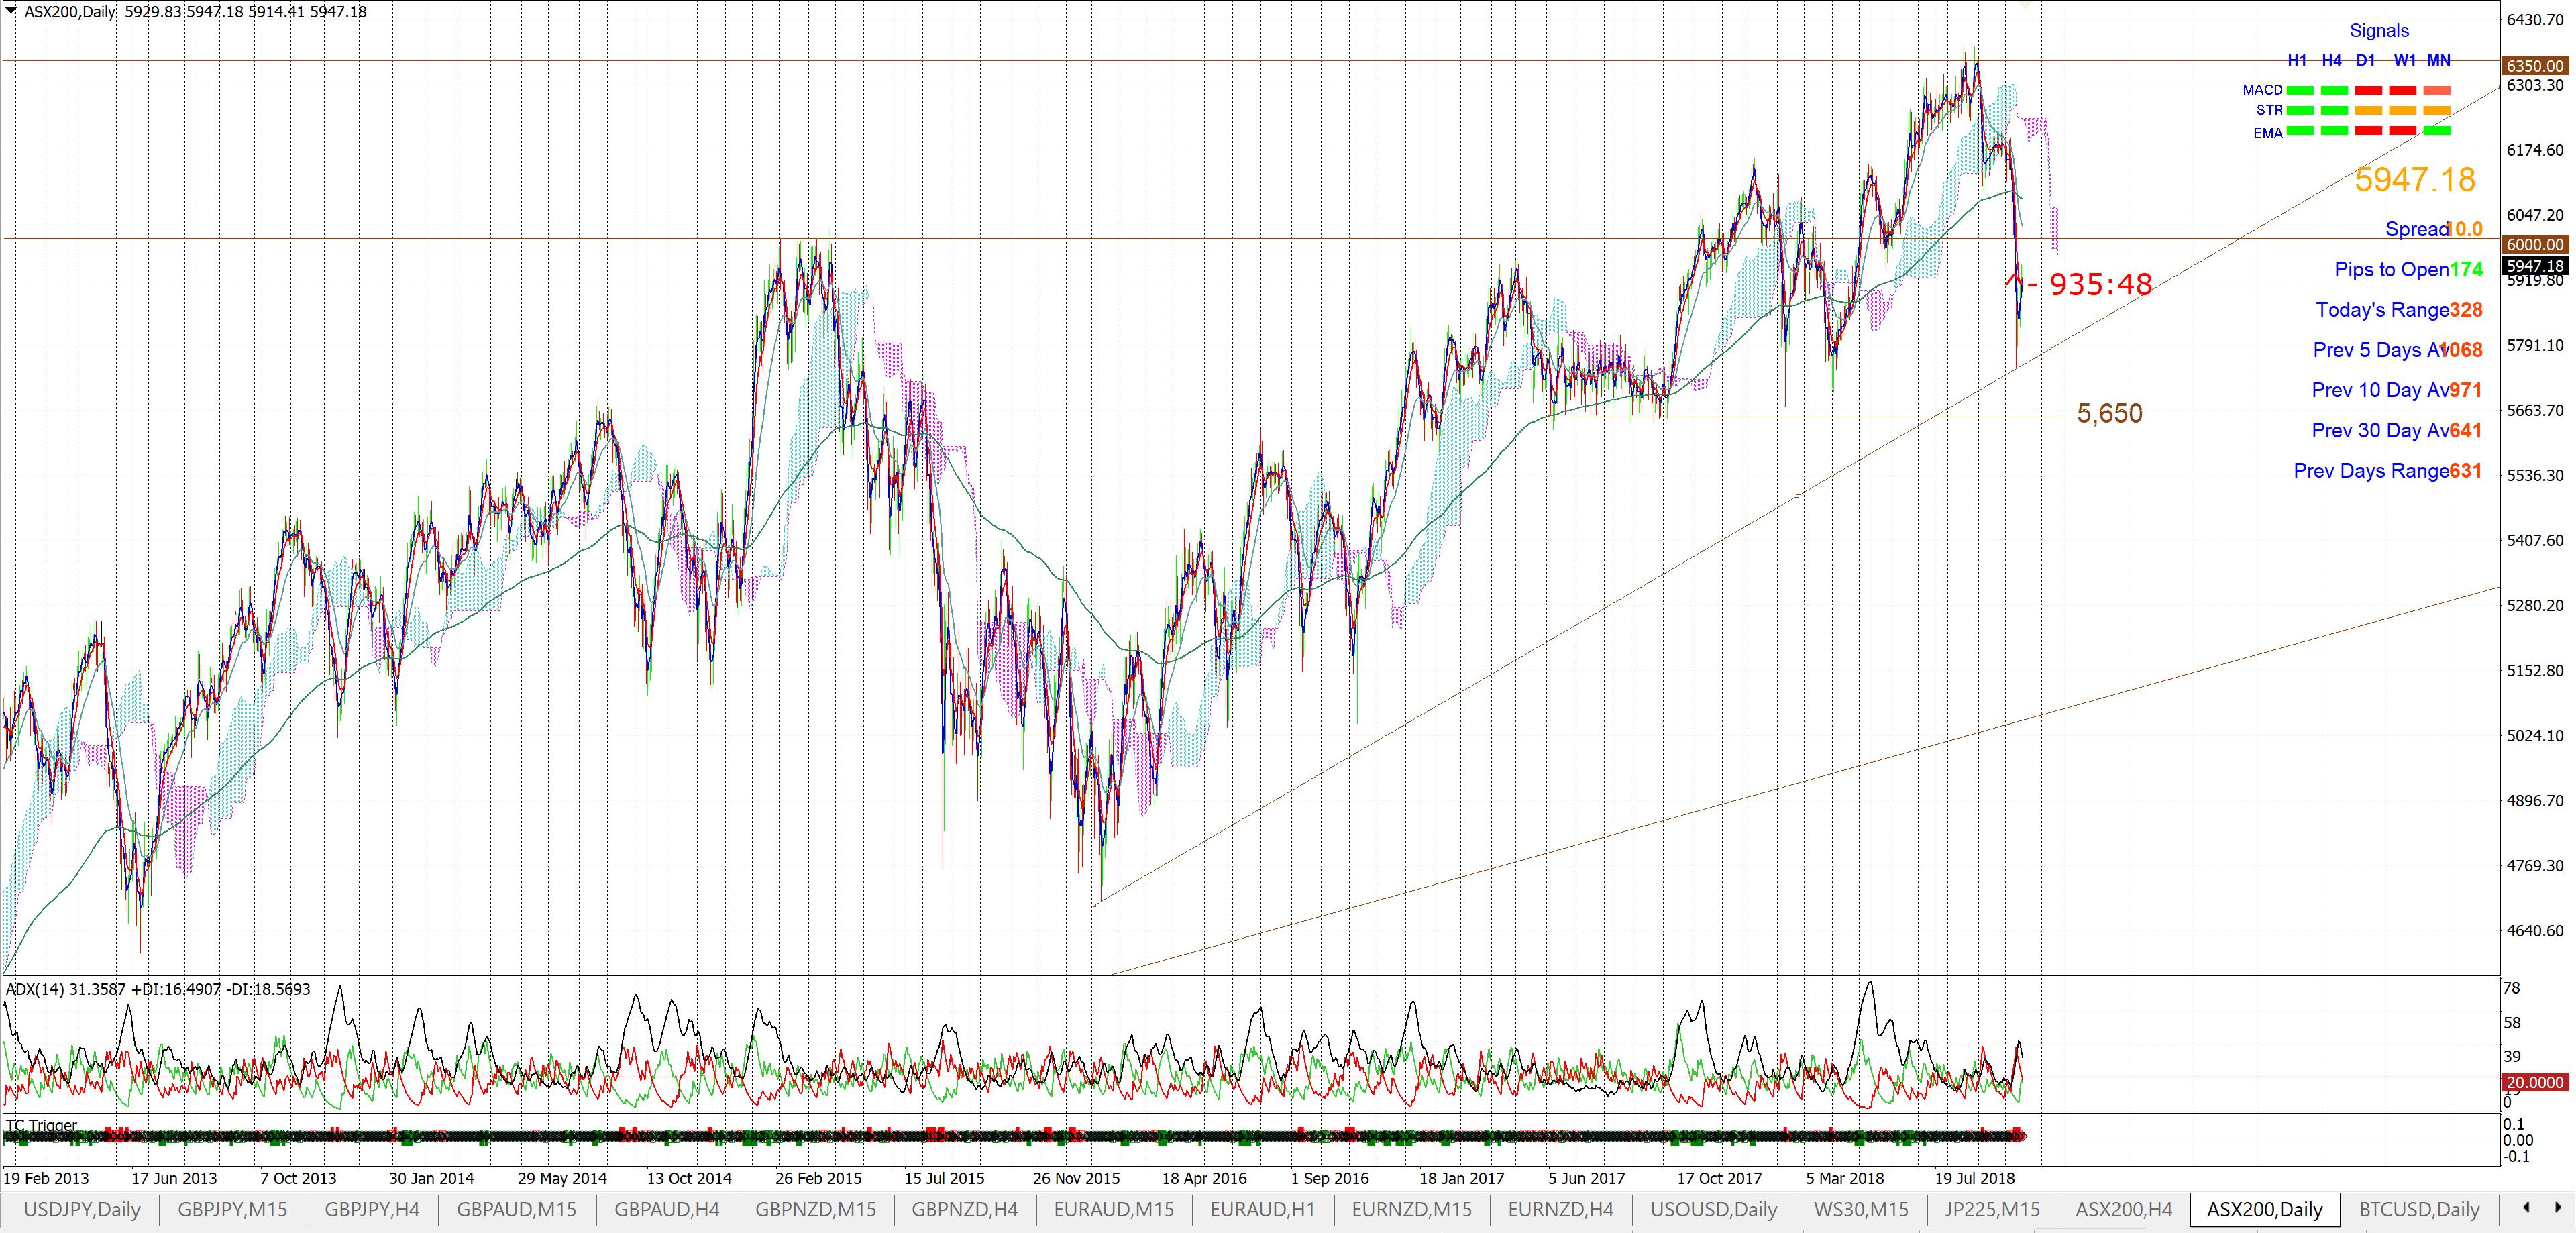
ASX-200 daily: This chart shows how 6,000 is an important level and that 5,650 has been recent support. There is also a fairly consistent pattern of higher Highs and higher Lows since Jan 2016 that remains intact. Watch this daily chart support trend line for any new make or break activity.
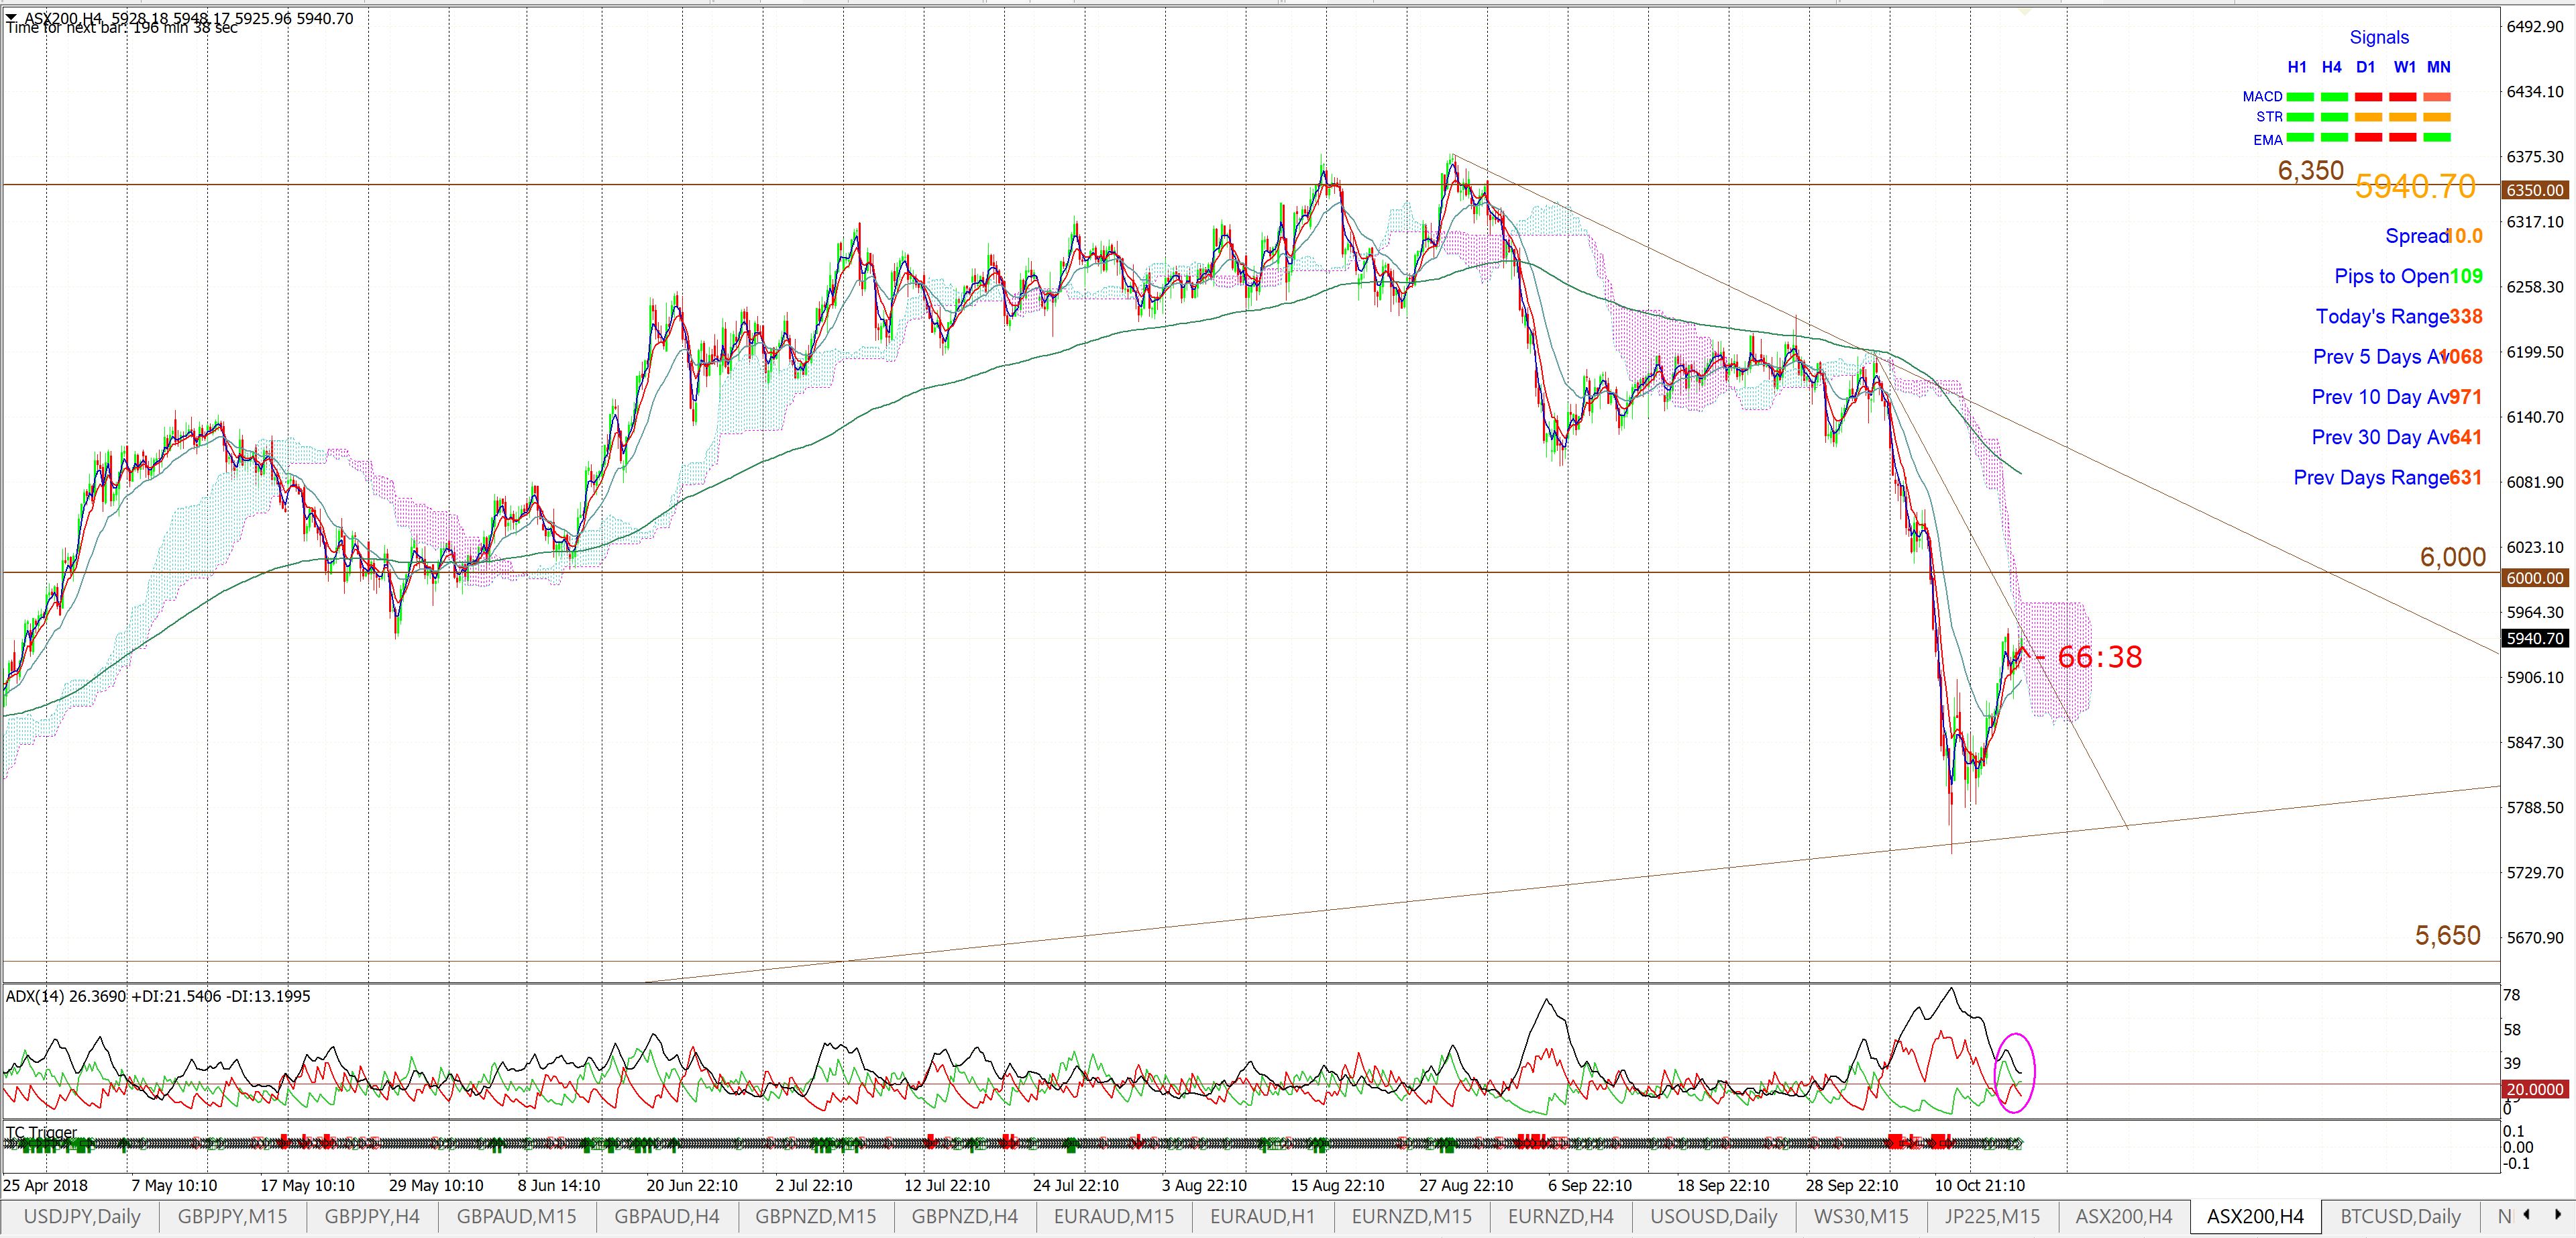
ASX-200 4hr: Price action has been declining over recent weeks but note, also, how momentum has been declining for the last two weeks as well! Watch the 4hr chart’s proximal bear trend line followed by the 6,000 S/R level for any new make or break activity.
Summary: The ASX-200 / XJO remains in an uptrend since the 2009 Lows. The whole-number level near the all time index High, at 6,800, remains the key level to battle but the 6,000 level is also a major Support and Resistance zone. Price action has been in a downtrend for the last few weeks but the uptrend since 2016 is pretty well intact. The 6,000 level might remain a battle ground for the rest of this month but a weekly close back above this region would be rather bullish.
- Watch the 4hr chart’s bear trend line and the 6,000 level for any new make or break.