The Ascending Triangle is a bullish continuation pattern. Technical theory suggests that the ‘height’ of the triangle can be used as a target for any bullish extension above the breakout trend line. An example of this is shown below.
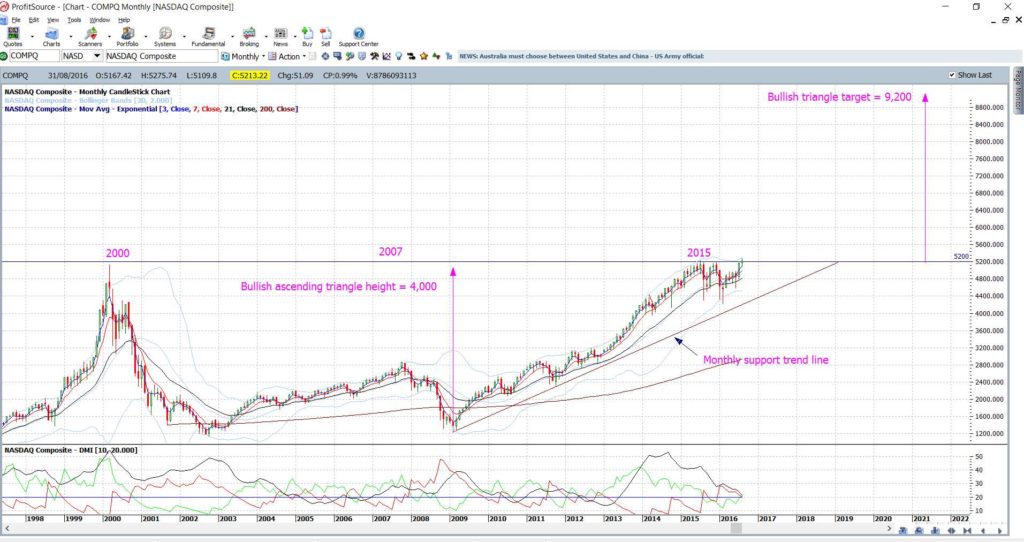
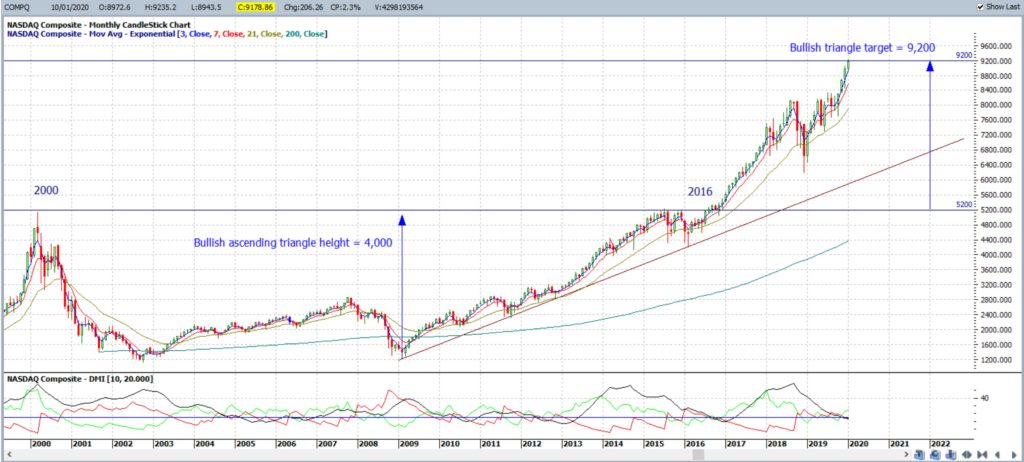
NASDAQ: This ascending triangle breakout took a few years to complete but the 9,200 target was reached in January 2020:
NASDAQ monthly: new breakout chart posted on Twitter September 2016:
NASDAQ monthly: breakout completed January 2020
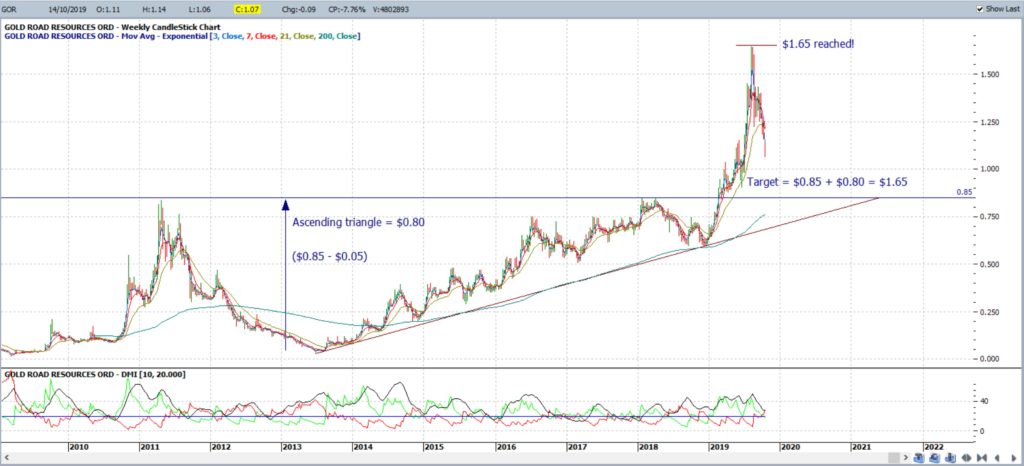
GOR weekly: this was setting up with a bullish continuation ascending triangle and gave a bullish breakout in March 2019. The height of the triangle was $0.80 cents and so the target for any breakout above the upper $0.80 trend line was $1.65:
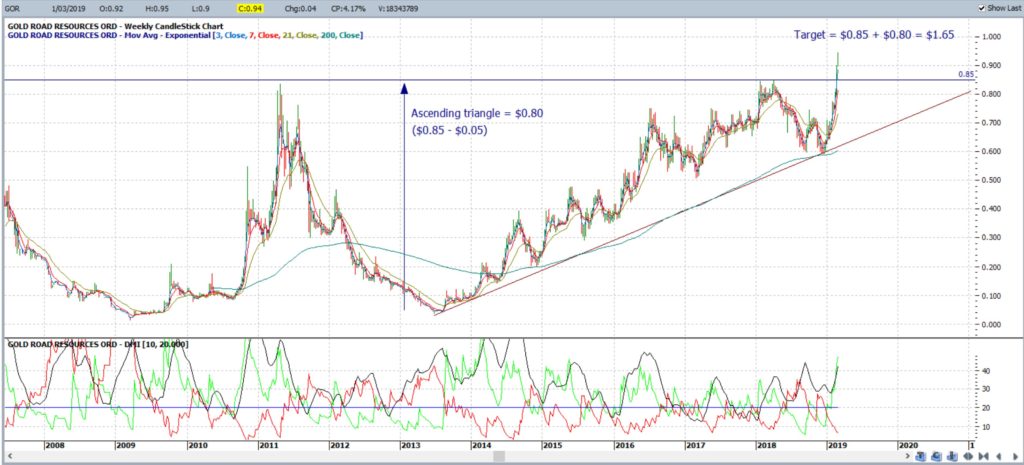
GOR weekly: note how this target of $1.65 was reached by August 2019:
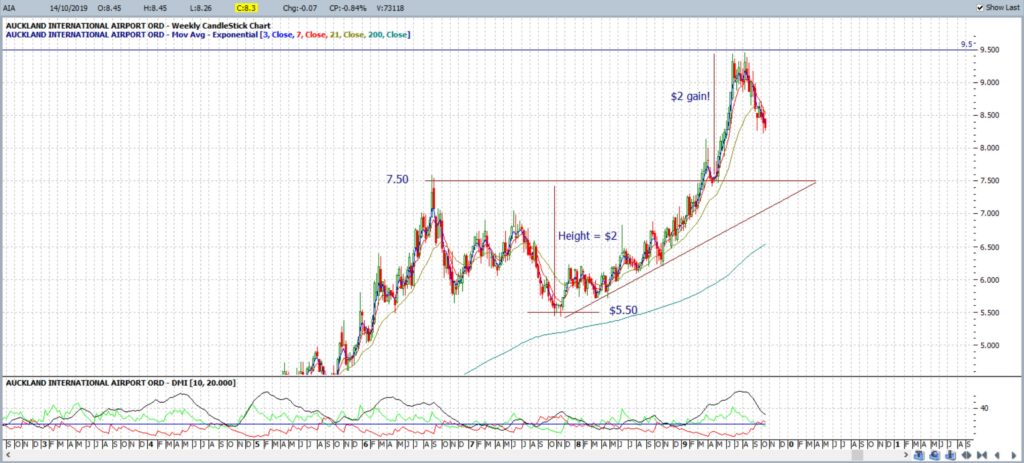
Another completed ascending triangle breakout is shown below. Here the height was $2 and so the target for a breakout above $7.50 was $9.50. This region was reached before price action stalled:
AIA weekly:
