I had my TC algorithm coded for use on the Trading View platform during 2018. This post documents how TC can be applied to trading stocks on a short-term frame using Target stock and the S&P500 as two examples. As with the use of TC in Forex trading, analysis begins with a broader view of the longer term charts to assess relevant Support / Resistance and Fibonacci retracement levels to help identify profit targets.
Example 1: Target TGT
November 27th 2018:
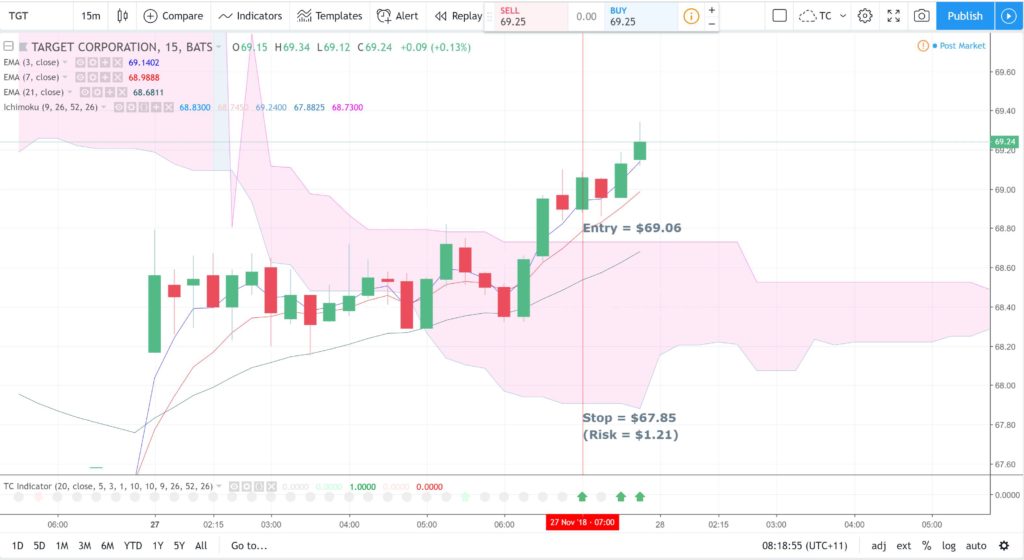
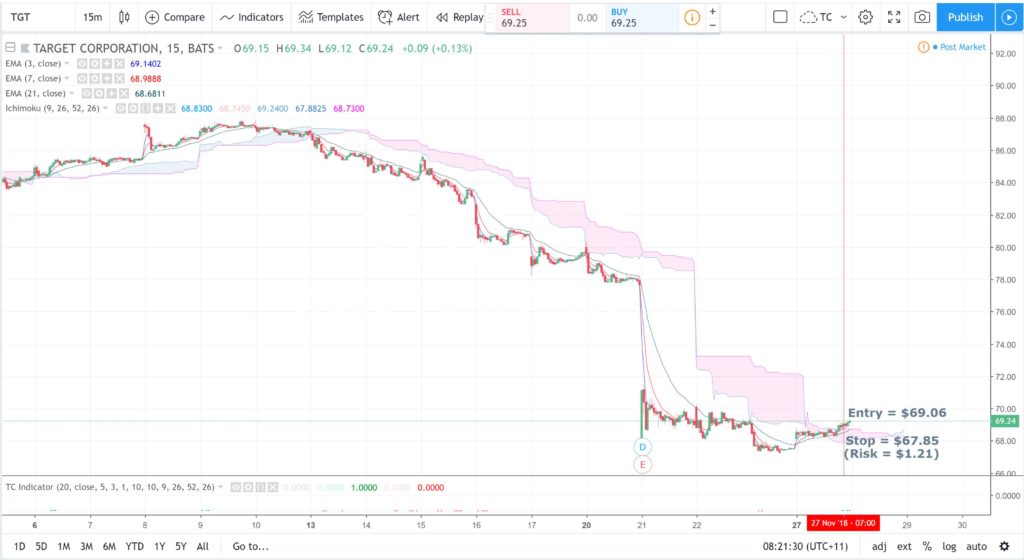
Target (TGT) peaked at $90 back in September 2018 but has fallen sharply since then and the last time Target was above the 15 min Ichimoku Cloud was back on November 9th, some two weeks ago. Since then, price has fallen from the $88 region down to near $67, a drop of around $21. Price action broke back above the 15 min Cloud during trading on Monday 26th November though and this move triggered a new TC LONG signal. The application of TC to stocks is relatively new so I’ll be watching to see how this signal on Target fares.
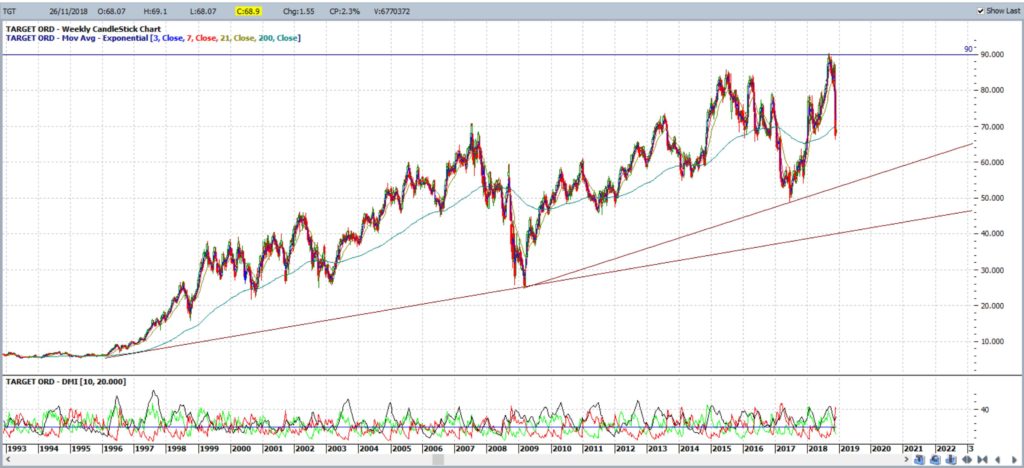
TGT weekly: Price action has been in an uptrend since the late 1990s and peaked at $90 in September 2018. There has been a sharp pullback since then though, however, longer-term support trend lines remain intact for the time being:
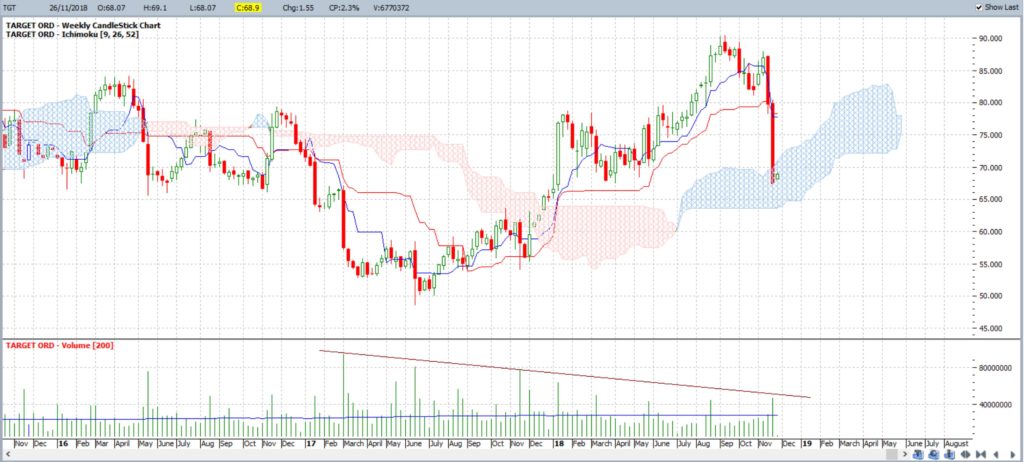
TGT weekly Cloud: price action remains above the support of the weekly Ichimoku Cloud for now but note the most recent two large bearish weekly candles:
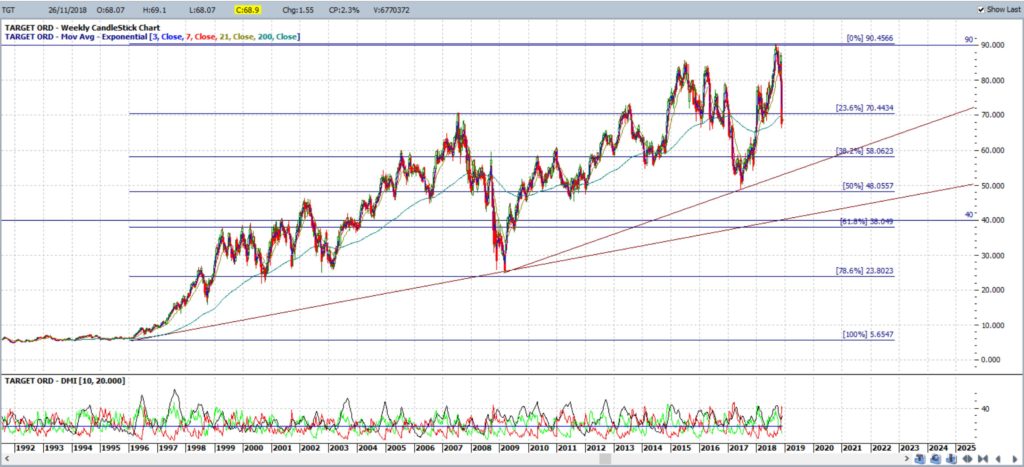
TGT weekly retracement: this has been a long swing High move on Target and, yes, it’s been made up of a few smaller swing High moves. The longer-term move though has a 61.8% retracement level down near $40 so, IMHO, that would be the worst case scenario pullback region to monitor:
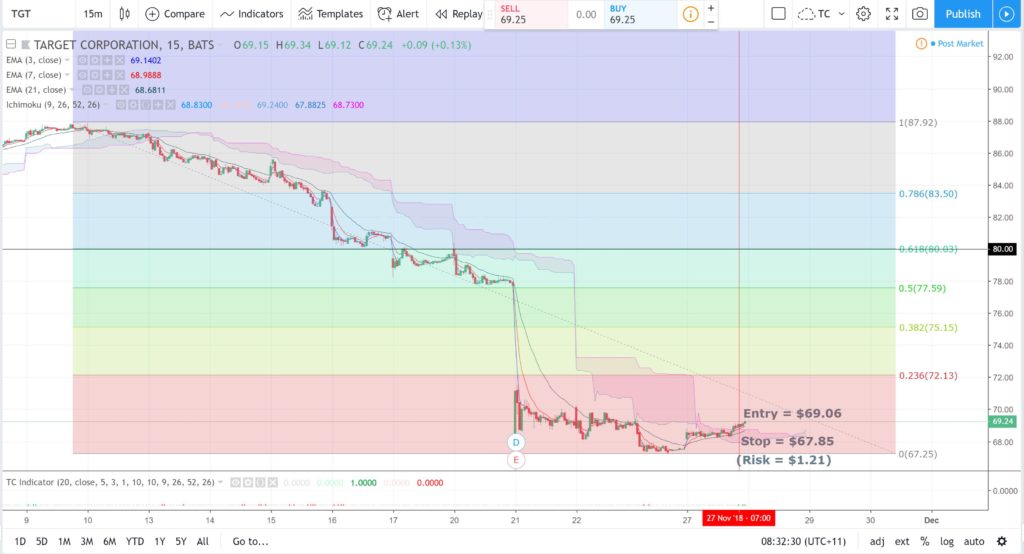
TGT 15 min: there was a new TC signal here during Monday’s trading session. This triggered after the close of the candle at $69.06. The Stop would need to be placed below the Cloud and this would be at $67.85 for a total Risk of $1.21:
TGT 15 min: the last time price action was above the 15 min Cloud was back on November 9th. Thus, there is potential for some relief rally, even if the overall trend continues lower:
TGT 15 min: The 61.8% fib retracement of this latest swing Low move is up near $80 S/R and so that would be the target (no pun intended) for any continued recovery move or relief rally. Any peak at $80 would mean a price gain of $10.94 (from the $69.06 Entry). Thus, the Return on Risk factor, R, would $10.94/$1.21 = 9 R.
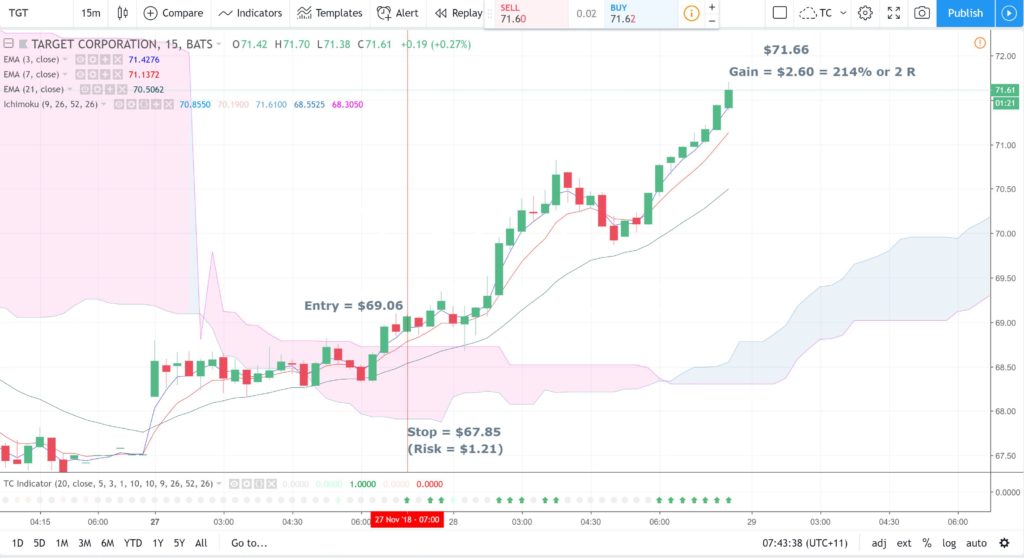
November 28th: The TC signal from yesterday has rallied on to give over 200% or a 2.14 R return on risk in just one trading session. The signal is still going and I will be watching for any push up to the $80 target level:
Example 2: S&P500
This TC signal delivered a 260% Return on Risk after just three days.
November 27th 2018
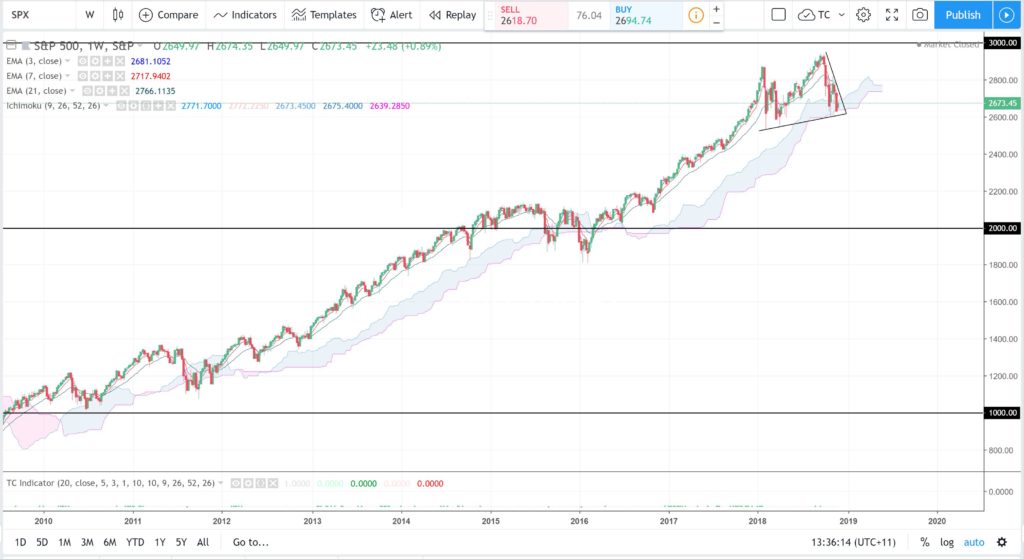
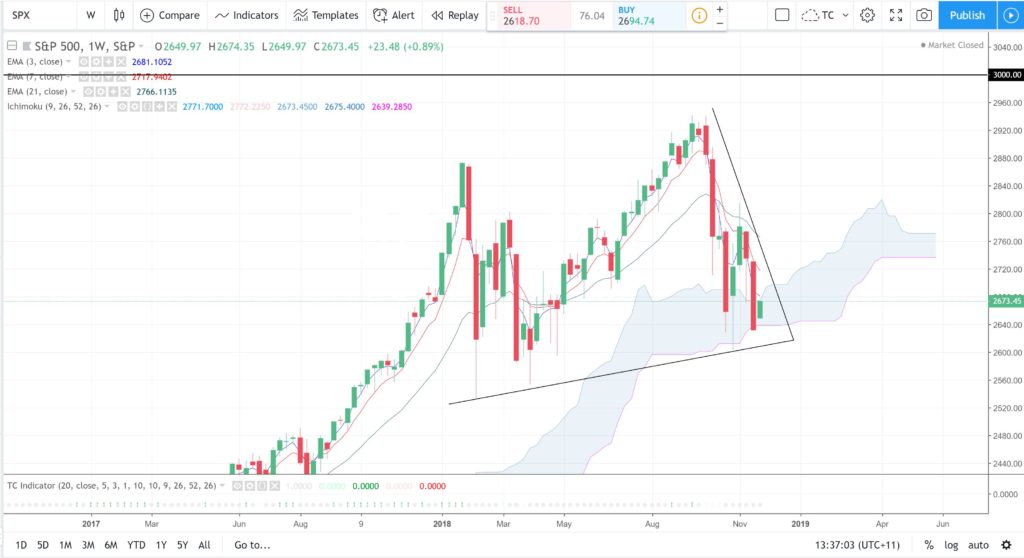
The S&P500 has been in a downtrend for the last few months and has traded down to the bottom of the weekly Ichimoku Cloud. This region can often act as decent support though so I have been monitoring this region to see if price action might try to carve out a bounce from here at all; either a temporary relief rally or a recovery effort. The week has started off positively for the Index and there has been a new 15 min chart TC signal to LONG and so I’ll be watching for any follow-through.
S&P500 weekly: price action is trying to bounce up from the support of the bottom of the weekly Cloud so watch for any follow-through here:
S&P500 weekly: a close-up look at this weekly chart price action showing support from bottom of weekly Cloud:
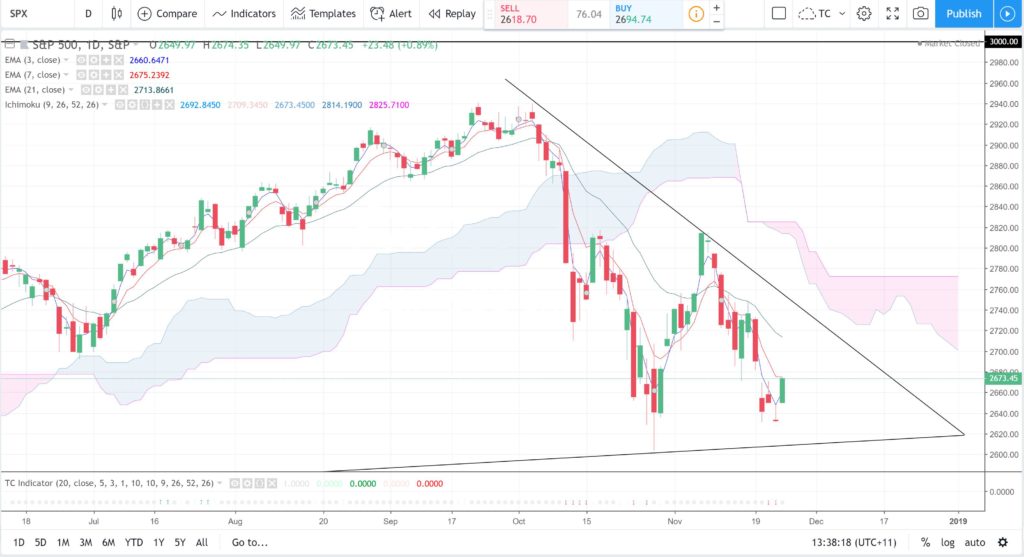
S&P500 daily: still consolidating under the Cloud on the daily chart:
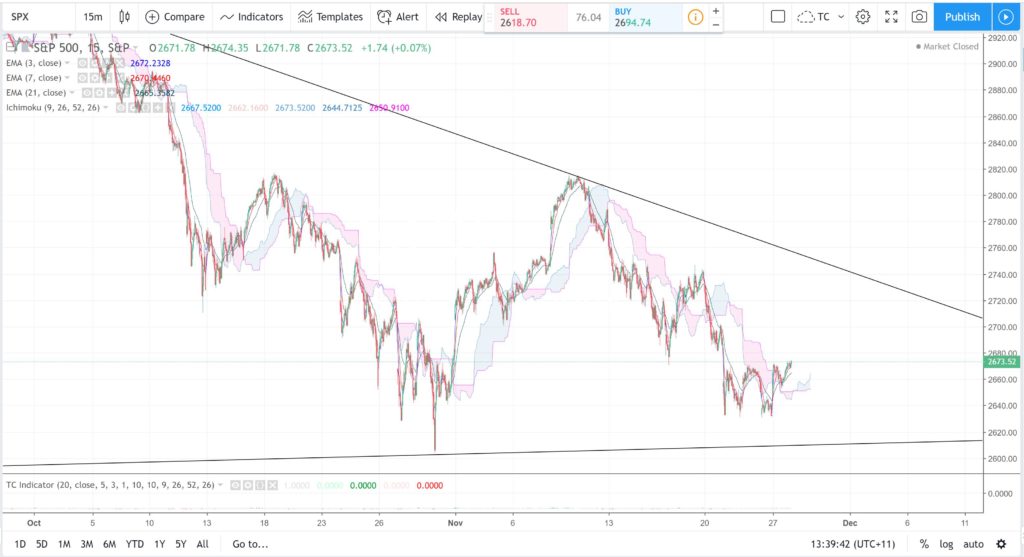
S&P500 15 min: the condensed 15 min chart shows price trying to recover above the Cloud:
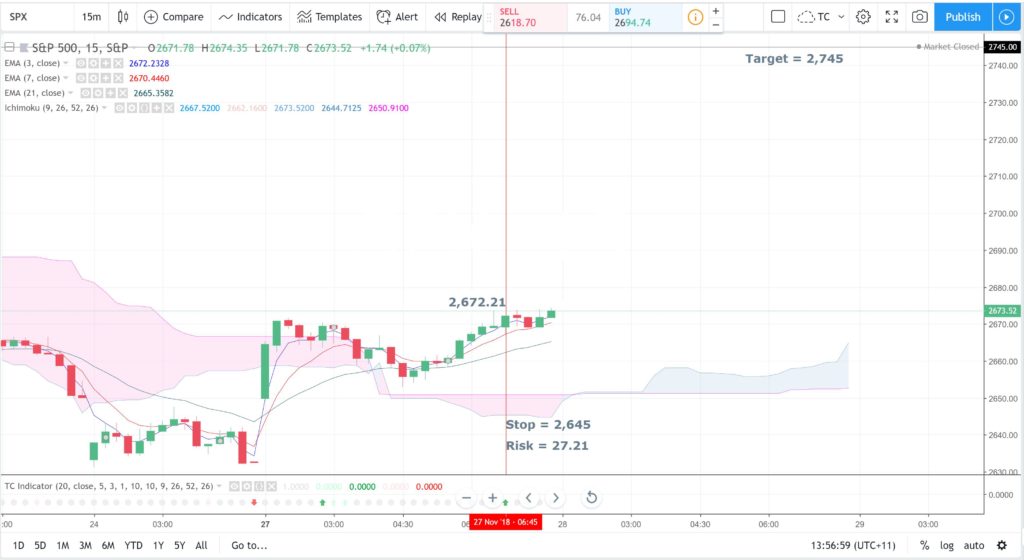
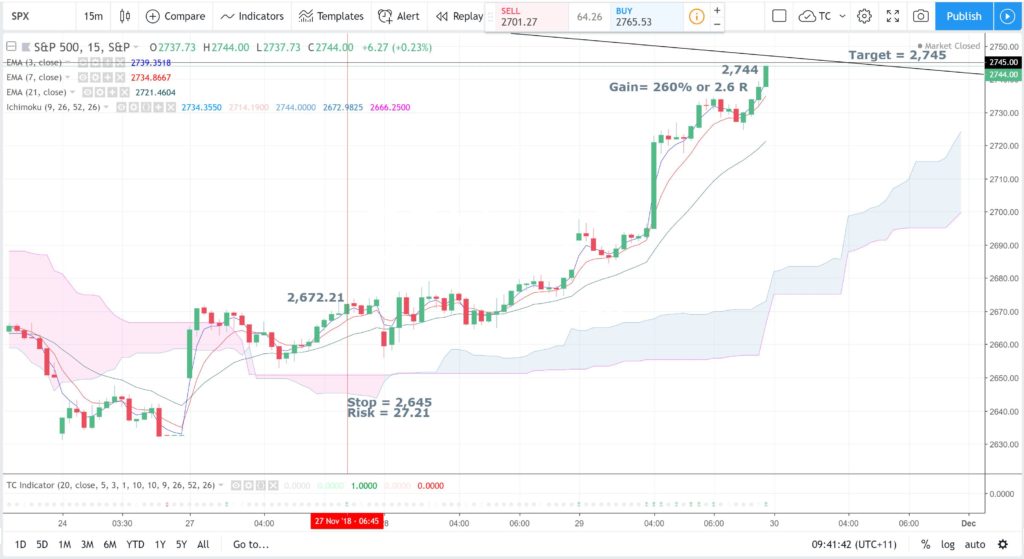
S&P500 15 min: the 61.8% fib of the recent swing Low is near 2,745 and so that would be the target for any continued recovery move. This level also aligns with the bear trend line for extra confluence:
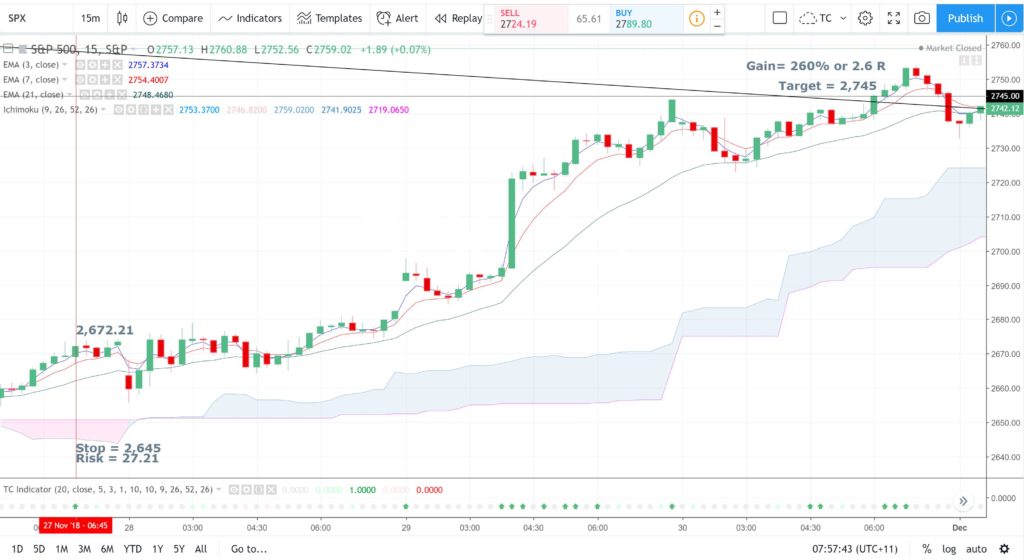
S&P500 15 min: There has been a recent TC 15 min LONG signal. Entry was at 2,672.21. The Stop would be 2,645 giving a Risk of 27.21 points. Any push up to the Target at 2,745 would mean a gain of 72.79 points. This would offer a Return on Risk for the trade of 72.79/27.21 = 2.6 R
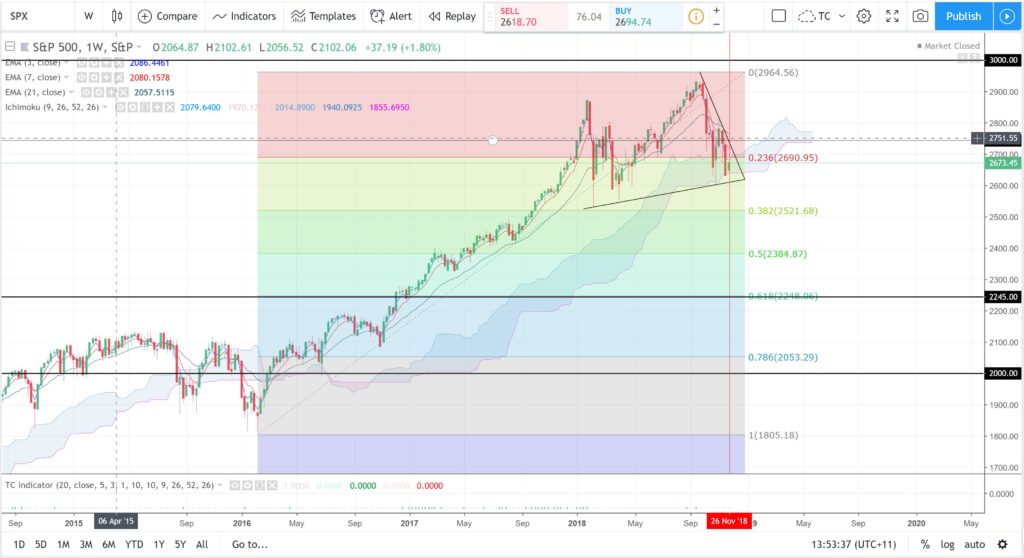
S&P500 weekly: any breakdown though and close and hold below the weekly Cloud would have me looking for a push down to test 2,245 though ass this is near the 61.8% fib of the last swing High move:
November 29th 2018
It took just two days for this profit target to be essentially reached giving a 260% Return on Risk or a 2.6 R trade result:
November 30th 2018:
The target of 2,745 was actually hit during the following trading session:


