I was introduced to another US market metric yesterday, the State Coincident Index, and am sharing this information with you in this post.
This single index gives a snap-shot view about how the economy in each of the 50 US states is progressing with respect to four criteria:
- NFP (non-farm payroll employment)
- the average hours worked in manufacturing by production workers
- the unemployment rate
- wage and salary data
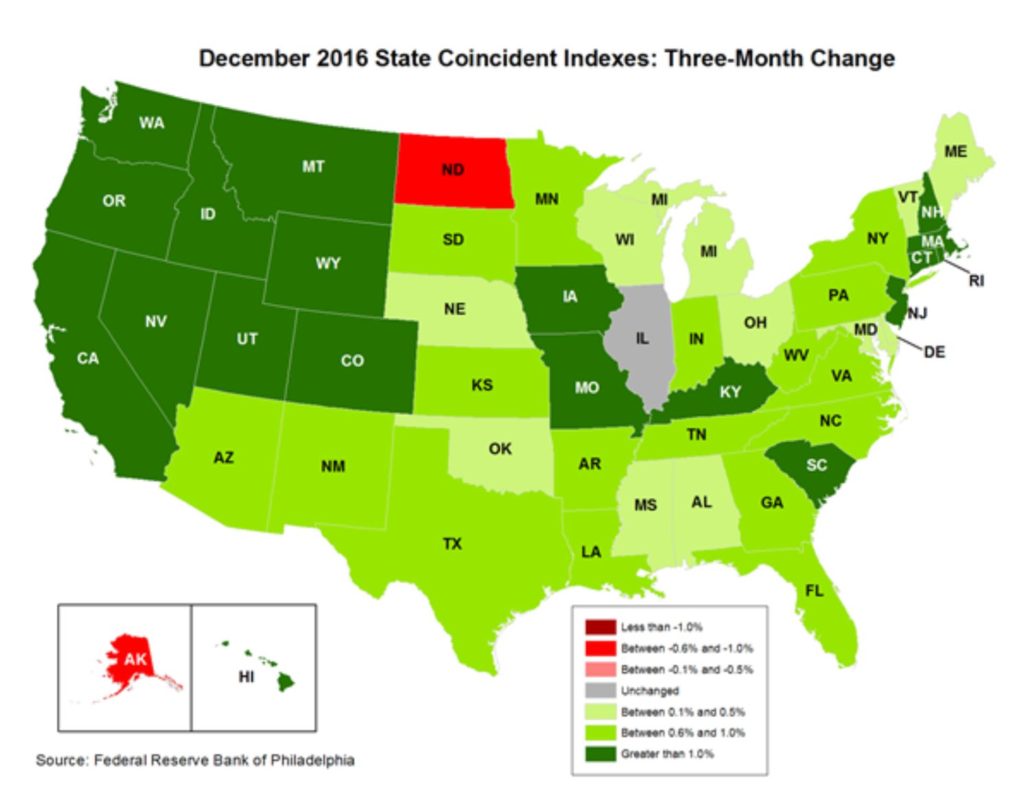
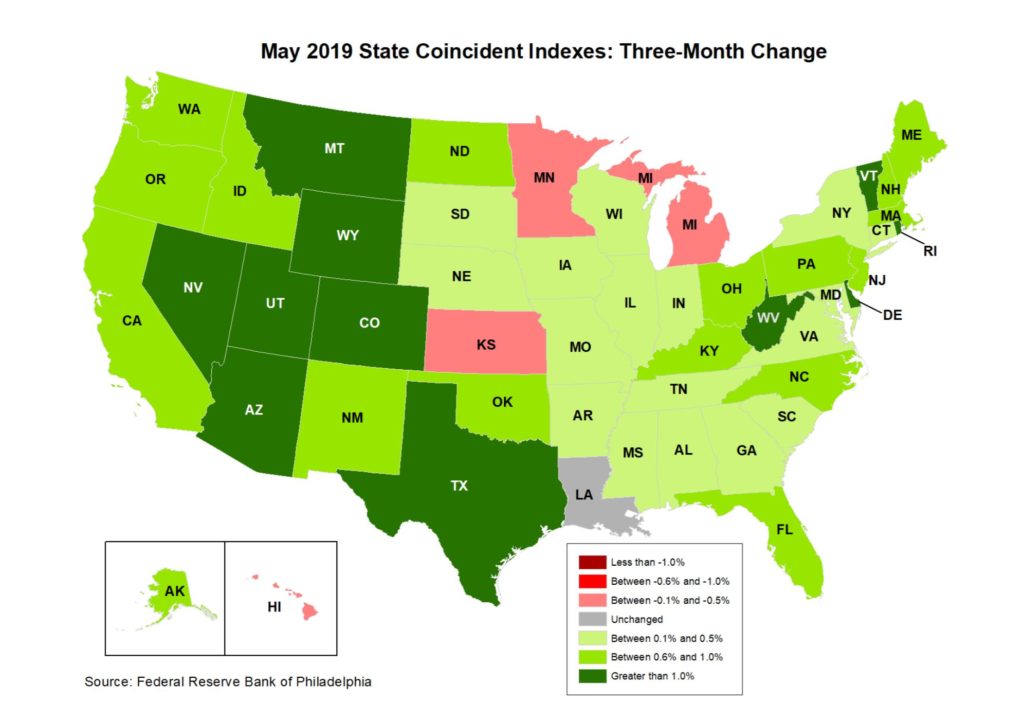
The data presents as a ‘heat map’ type of view making for an easy visual assessment of progress, or otherwise, for each of the 50 states. Two maps are shown in this post; one from the end of President Obama’s era and the latest result under President Trump.
End of President Obama Era: this chart shows the heat map result for December 2016; the end of the Obama era. There are two states with negative growth but all others are positive. There are 18 states with growth of over 1%:
Current era with President Trump: the current heat map shows a disturbing shift for numerous states towards negative growth and declining growth. There are 5 states with negative growth. There are now only 11 states with growth of over 1%. Note the spread of these states as well; they are more in the mid west region which is traditionally claimed to be the Trump supporter base.
Based on this objective set of data, it does not seem that America has been made great again. The next data release is on July 24th so will be worth checking to see if there has been any significant improvement or decline.


