I have not given this ASX stock much consideration over recent years as price action has been in constant decline. The stock remains in the news but for all the wrong reasons. However, a recent mention in a Tweet got me looking over the charts of this stock once again. Regular readers of my material will be aware of my preference for the bullish-reversal Descending Wedge chart pattern so you might imagine my surprise when I discovered one of these appearing on the beleaguered AMP. There are no guarantees with any technical analysis, of course, but monitoring for momentum-based trend line breakouts can be a successful way to search for new trading candidates.
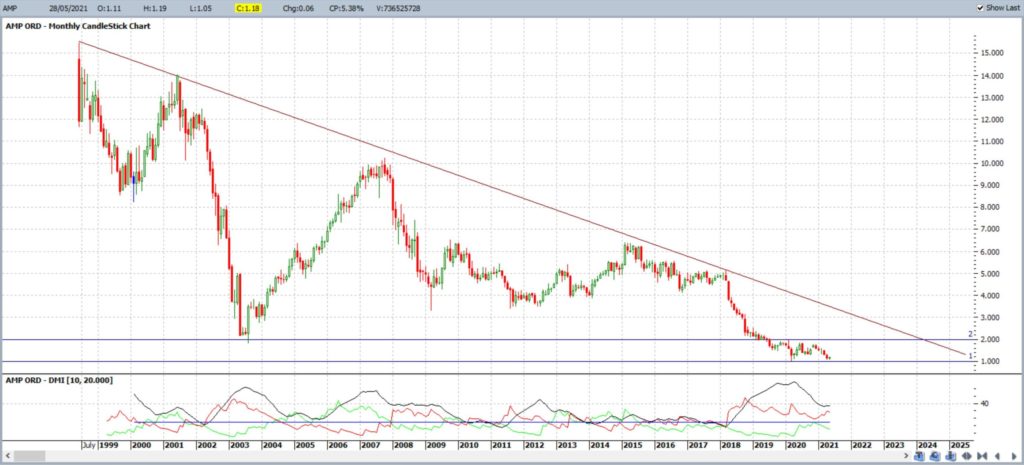
AMP monthly: the trend has been down but price action seems to have found some support from the $1 level:
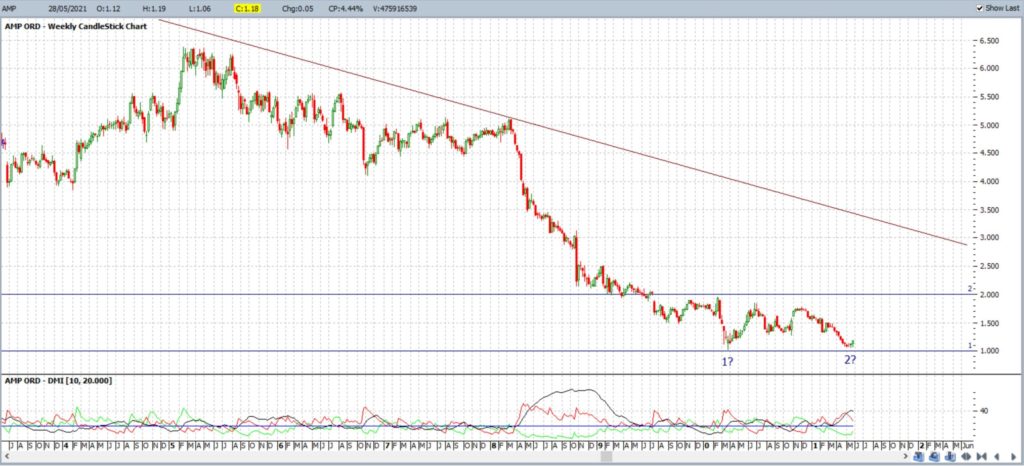
AMP weekly: Note the look of a potential bullish-reversal Double Bottom at the $1 level:
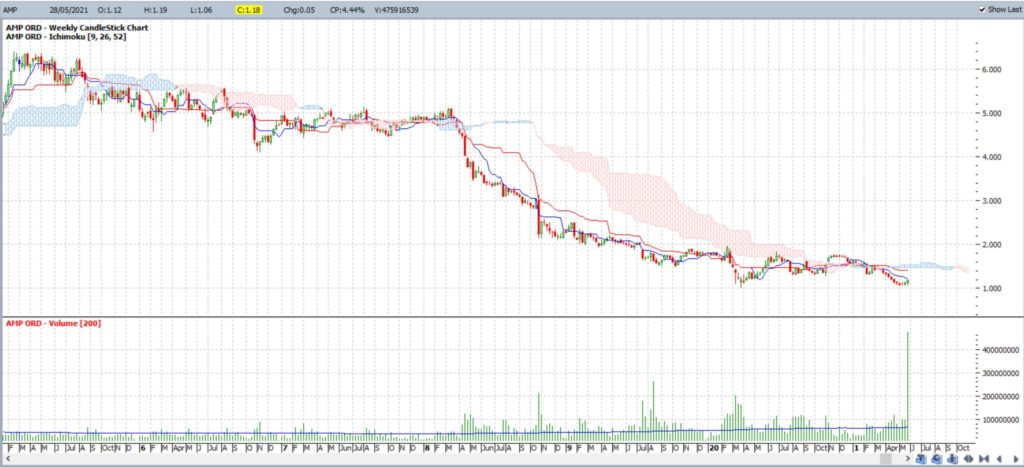
AMP weekly + Volume: note the jump in Volume last week. Someone seems to know something?
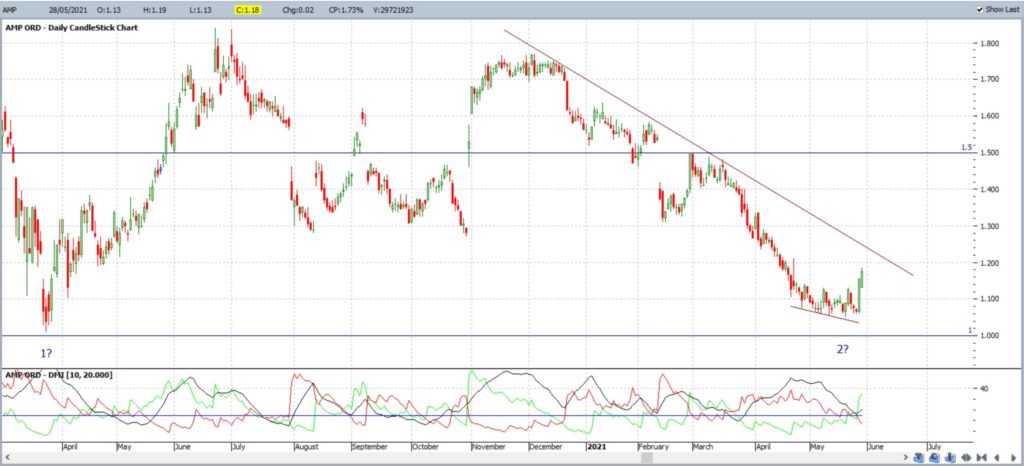
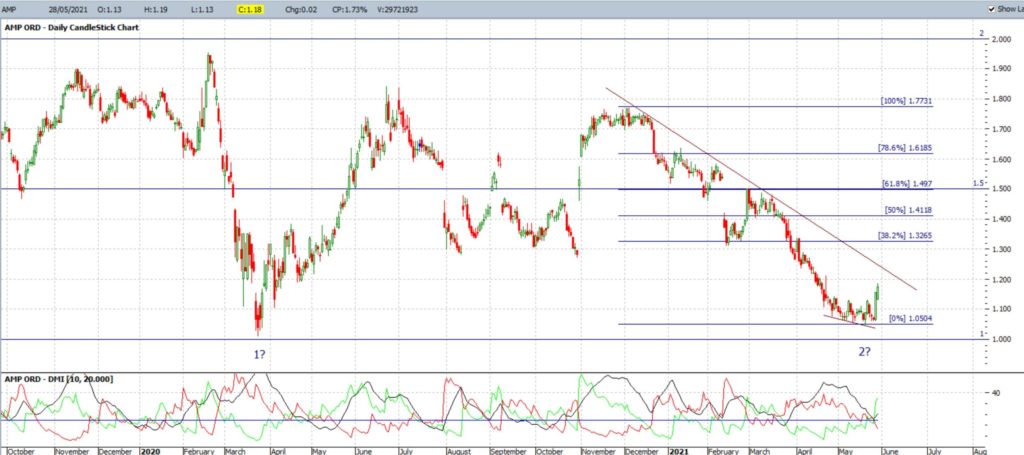
AMP daily: this is the other surprise for me! Note the look of a bullish-reversal Descending Wedge pattern on the daily time frame. Bullish momentum is currently on the rise with the +DMI (green line) and ADX being above the 20 threshold and on the rise:
AMP daily + Fibonacci: The addition of a Fibonacci retracement can be a useful tool to help identify potential bullish targets. The 61.8% Fibonacci is a popularly used target level in mean reversion moves and for the Dec 2020 – May 2021 swing low move on AMP this level comes in near the $1.50 level. Note, also, how this $1.50 is also a reaction zone for price action with AMP. Thus, any bullish wedge breakout would bring the $1.50 level into focus followed by the previous High, near $1.80, and, then, the whole number $2 level.
Concluding thoughts:
AMP stock could be carving out a bullish-reversal Double Bottom above the $1 level. There is also the look of a bullish-reversal Descending Wedge on the daily chart. The trend has been down here for so long that one has to wonder if it might one day recover. The recent Volume spike would suggest that something is happening but what exactly, I do not know. However, I do know that watching for momentum-based trend line breakouts can be a very successful way to find new trading candidates and AMP might be worth watching for just such a breakout.


