AMD (Advanced Micro Devices) has been a favoured NASDAQ tech stock of mine to trade and I am currently LONG the stock after being assigned a Short Put at $12 some months ago. I have been watching for any test of the key $15 level and a recent triangle breakout has triggered such a test. This post contains charts of AMD and what I am looking for with future trading.
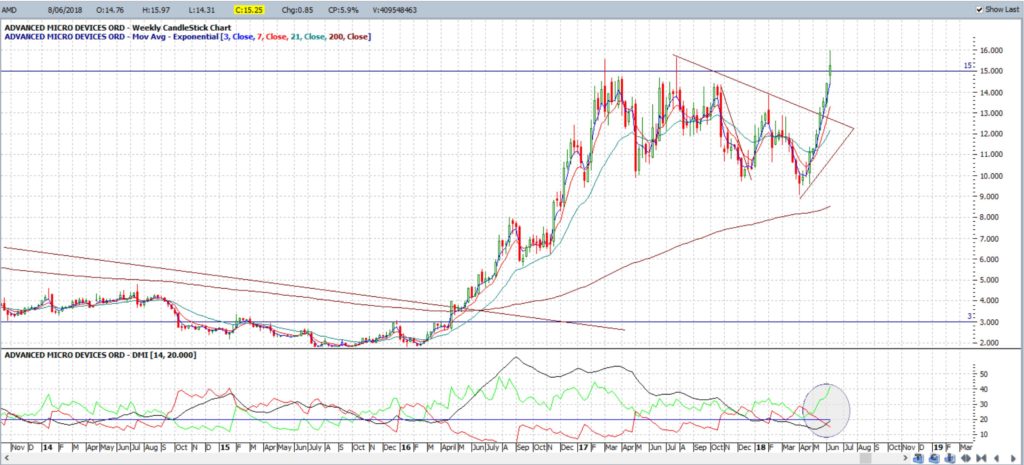
AMD weekly: there has been a triangle breakout and momentum is ramping up here now as well. Note the black ADX line:
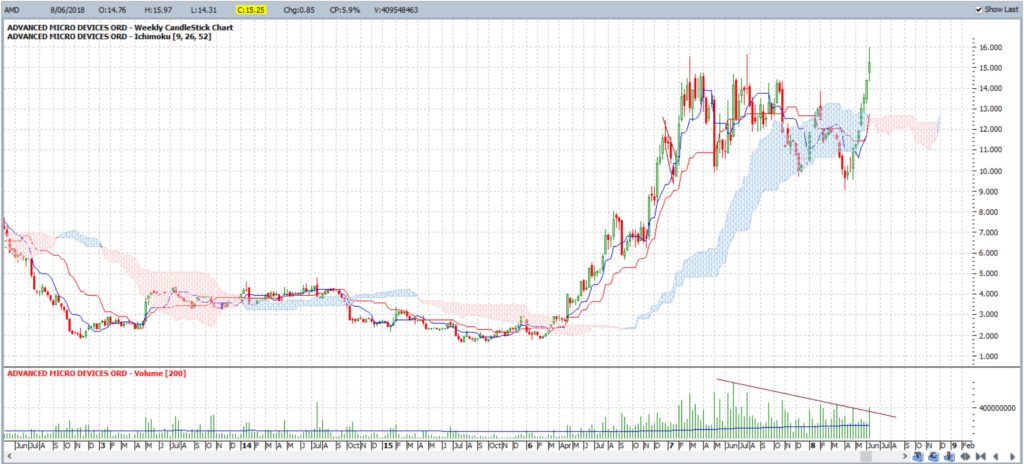
AMD weekly Ichimoku Cloud: price action is back above the weekly Cloud and note the uptick in trading Volume. All of these are strong signs that underpin bullish continuation:
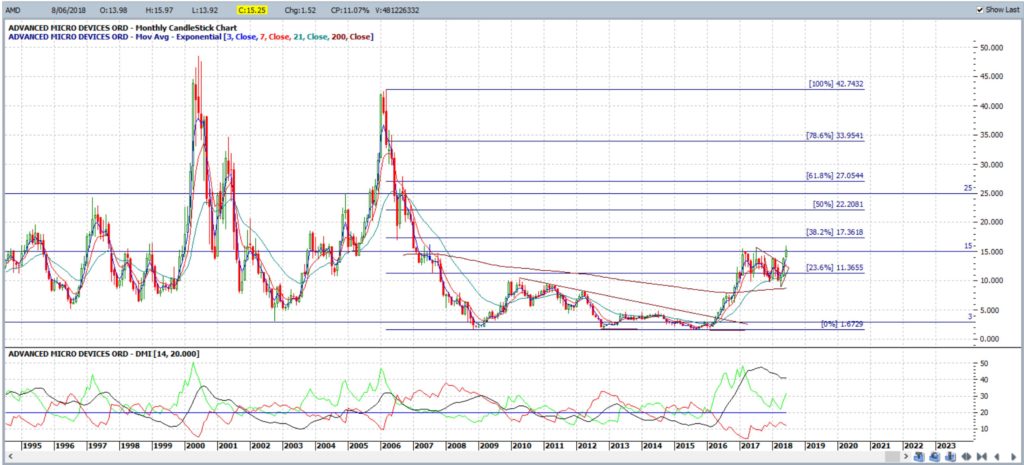
AMD monthly: AMD has not printed a monthly close above $15 since 2007! Watch to see how AMD closes for the month of June and any close above $15 would be a very bullish signal indeed. Any monthly close above $15 would then have me looking towards the $25 level as this is near the 61.8% Fibonacci level, a popular target in stock breakout moves, and is also previous S/R.
Summary: AMD has given a bullish weekly triangle breakout on increased momentum and a spike higher in Volume. Watch for any monthly close above $15 to underpin bullish continuation and, if so, the $25 would be an obvious target as this is near previous S/R and the monthly 61.8% Fibonacci retracement level.
Disclosure: I am LONG AMD stock.


