FX markets might be a bit slow but the same cannot be said about stock markets. Some stocks look as if they might be getting ready to breakout and one of these is Applied Materials Inc (AMAT). AMAT is just one of the NASDAQ stocks I am stalking and I have been selling Puts here since the previous triangle breakout (see chart below) and premiums have been very good. Now, whilst I don’t have a favourite child, I do tend to have favourite stocks and AMAT is one of them!
The stock is currently trading at $24.89 and has a Morningstar Fair Value estimate of $20. With a wide economic moat, good free cash flow and with a P/E ratio of 28.6 and well below the industry average of 44.6 the stock looks quite attractive. Merger plans with Tokyo Electron are viewed in favour of AMAT as well. I note some trading houses have AMAT rated as at ‘BUY‘ status.
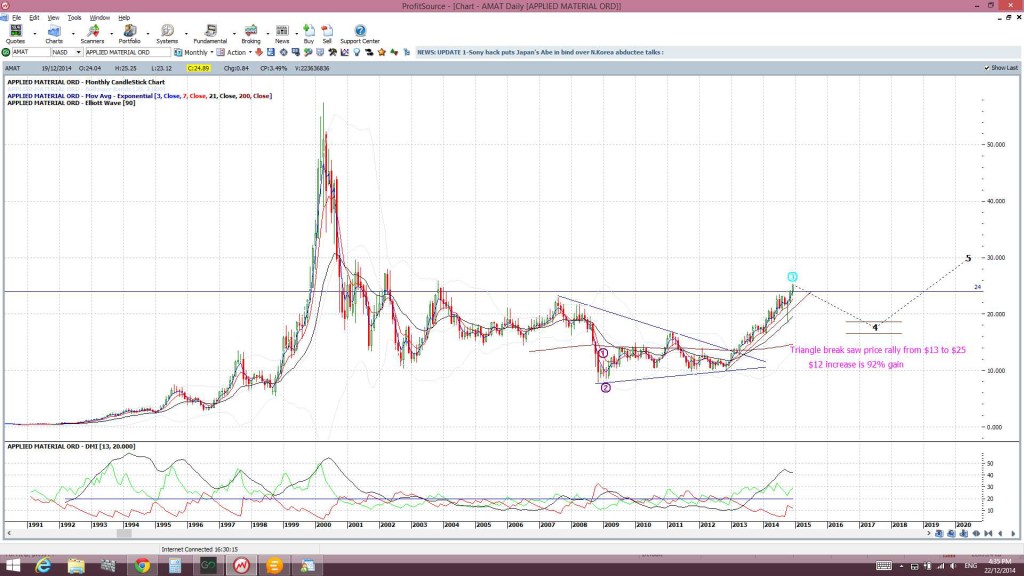
The stock is attempting to close the month above $24 and, if successful, this would be the first such close since 2003! The recent bullish signal on the weekly Ichimoku chart adds to support here.
AMAT monthly: any monthly close above $24 would be the first since 2003 and a hold above this level would suggest bullish continuation. Note the difference this time with momentum though:
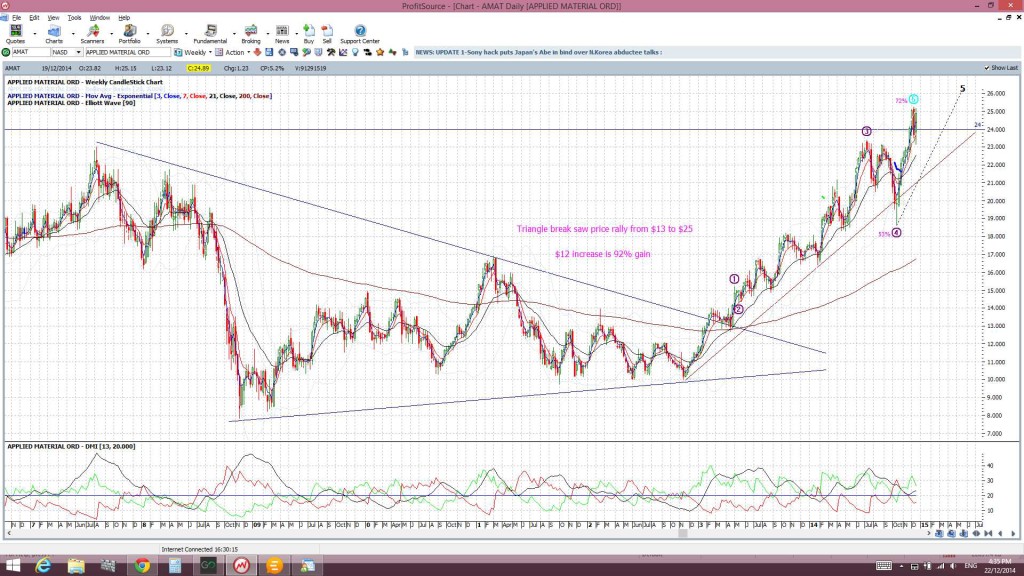
AMAT weekly: AMAT has closed above $24 on the weekly candle but I’m looking for any monthly candle close above the key S/R level.
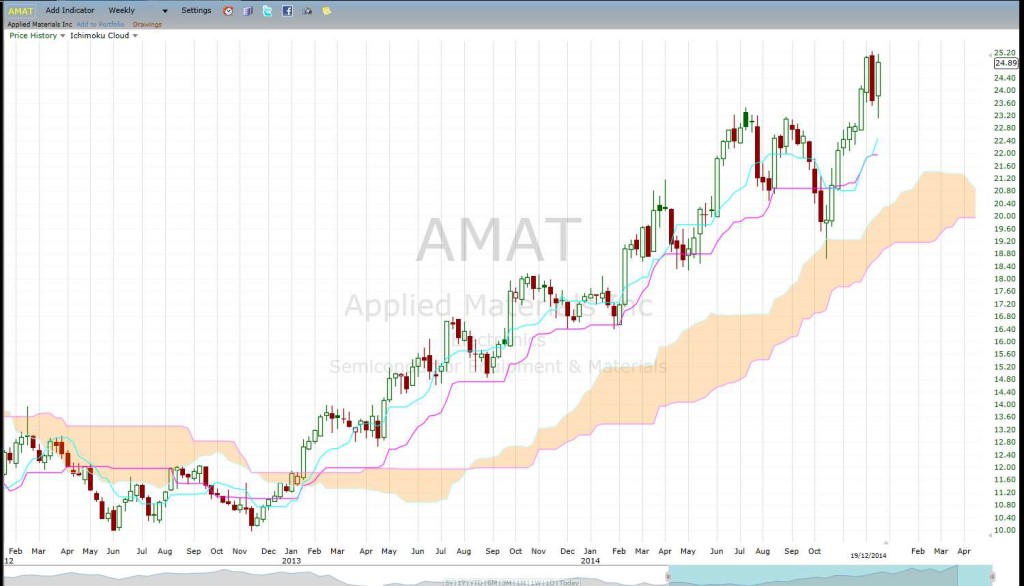
AMAT weekly: AMAT has made a recent bullish Tenkan/Kijun cross above the Ichimoku Cloud. This cross came above the Cloud and so is considered a ‘strong’ signal:
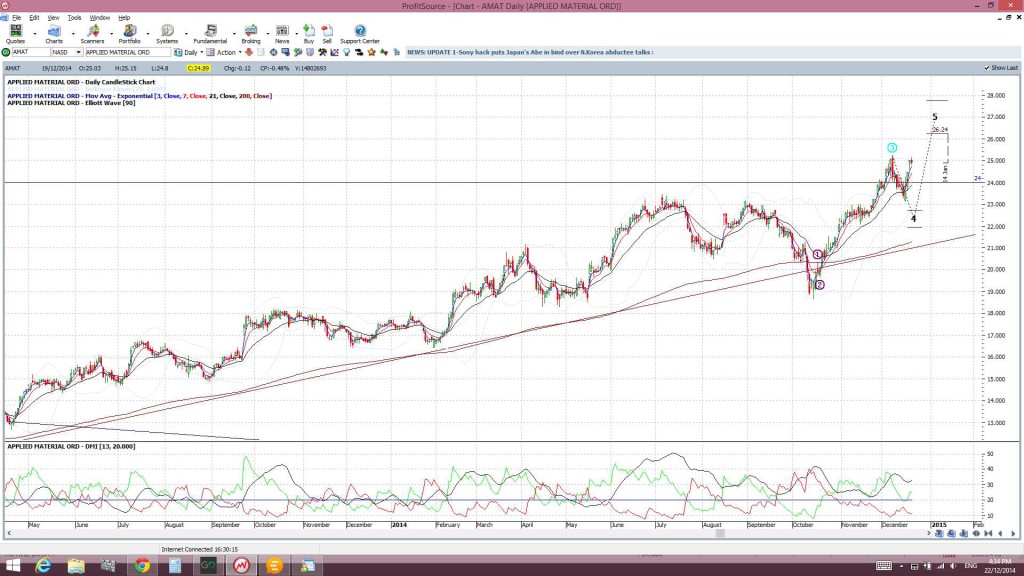
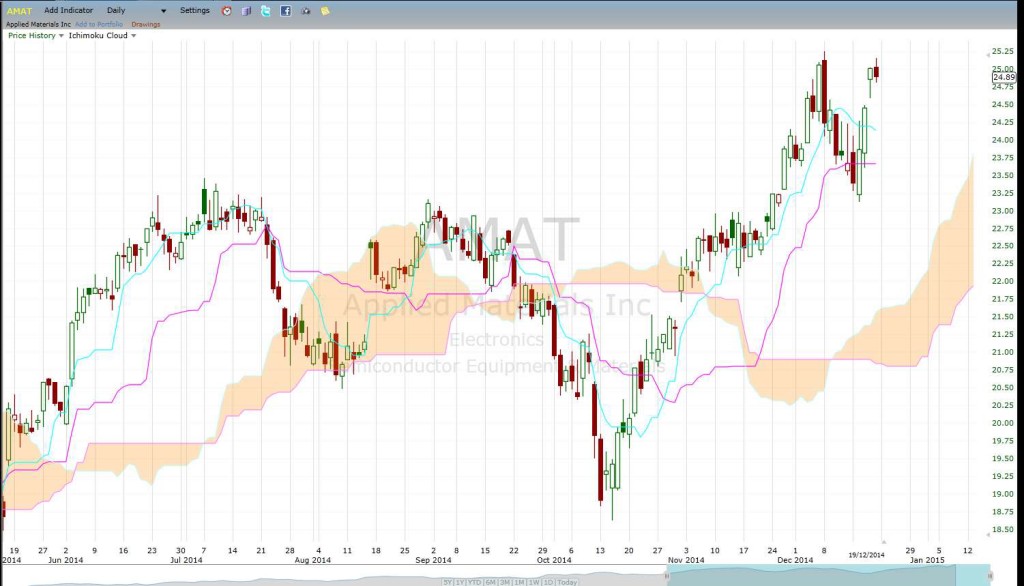
AMAT daily: testing the $24 level:
AMAT daily Cloud: well above the daily Cloud which is bullish:
Summary: Watch for any monthly close and hold above $24 for AMAT. There is history well above that price and I would look for continuation towards $50+. I am currently selling Puts on AMAT but, if there is a monthly close above $24, I will be buying stock and, possibly, selling Calls.


