The focus of this article is to help traders see how the ADX momentum indicator can be a useful adjunct to help identify breakout trading opportunities.
The following three charts offer a great example of how useful the ADX can be to help with identifying a new trend for any range breakout traders. The charts show the 30 minute GBP/JPY but the logic applies to any trading instrument and on any time frame.
Indicators:
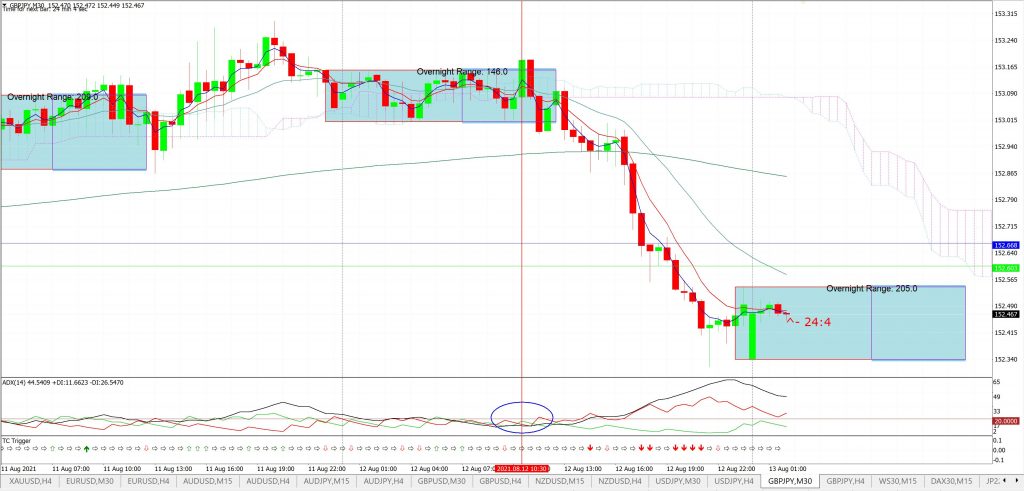
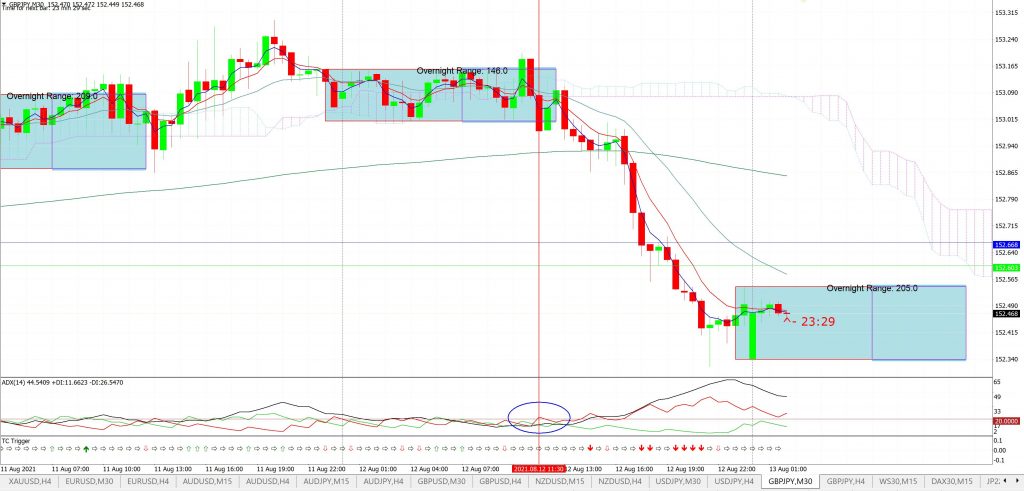
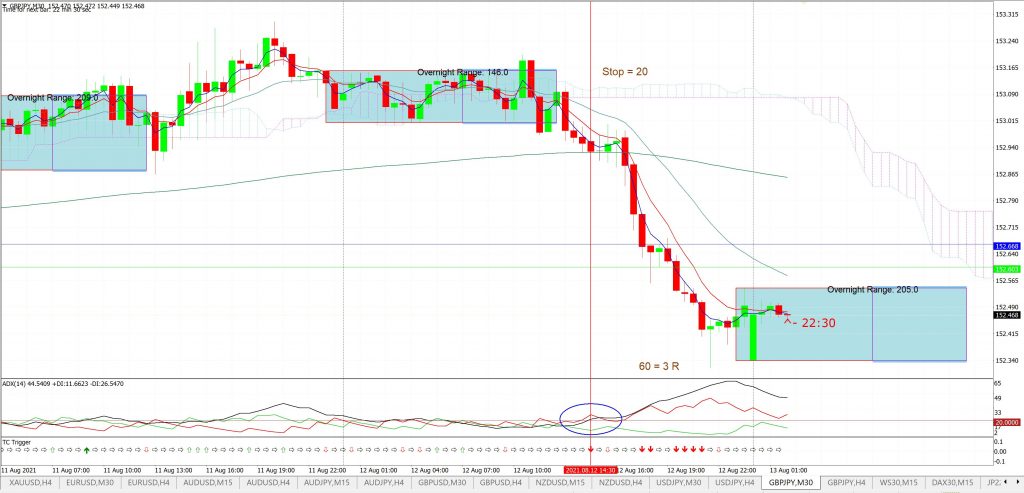
- Upper pane: the upper pane of these 30 minute charts show price action against a background of the Ichimoku Cloud and a Tokyo Box indicator. This Tokyo box roughly shows the Asian trading session, in the left hand box, and the start of the European session, in the right hand box. The rest of the space is the remainder of the European session and the US trading session.
- Lower pane: the lower pane shows the ADX momentum indicator and my TC Trigger proprietary indicator.
Chart One: Note how there was a bullish breakout candle from the Tokyo Box indicator during the early European session and this is highlighted by a vertical line. Look down to the ADX indicator though; click on the chart to enlarge the view. The ADX indicator, black line, and bullish +DMI indicator, green line, are both below the 20 threshold and this indicates an absence of decent momentum. Note, also, how my TC Trigger did not indicate any new trade signal.
Chart Two: Note how there was a subsequent bearish breakout candle from the Tokyo Box indicator that evolved shortly after the earlier bullish one. This is also highlighted by a vertical line. Look down to the ADX indicator again. The bearish -DMI indicator, red line, is just above the 20 threshold BUT the ADX indicator, black line, is below 20 and this is NOT supportive of any new momentum bearish breakout trade opportunity. Note, also, how my TC Trigger did not indicate any new trade signal.
Chart Three: Price action eventually drifts outside the range of the Tokyo Box Indicator but note how there is another push to the downside. The highlighted candle evolved with the bearish -DMI indicator, red line, holding above the 20 threshold and this was joined joined by the ADX indicator, black line. These conditions are supportive of a new momentum-based breakout trade and note how my TC Trigger also produced a new signal to SHORT, as seen with the down-pointing red arrow. Placing a STOP on the other side of the Cloud, from the close of this candle, gave a STOP size of around 20 pips and a trade result of near 3 R. That is, the gain or reward, was three times the initial risk.
Summing Up:
The ADX is just one of many indicators but can be a useful adjunct to any trading strategy that tries to identify momentum-based range breakout trading opportunities. I hope traders find these examples of some use and encourages exploration of the value of the ADX on other instruments and on other time frames.
Remember that all trading carries risk and to only ever trade with funds you can afford to lose and to always manage risk (2% per trade is a good starting guide).


