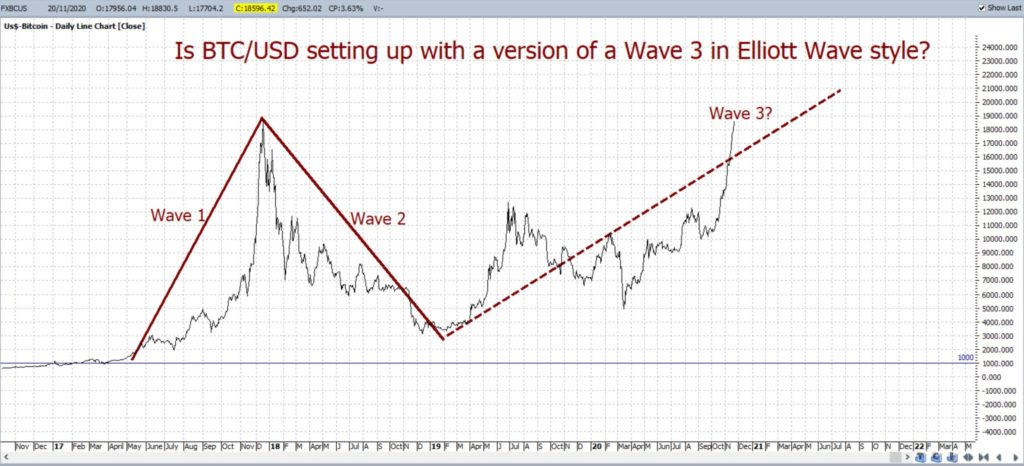
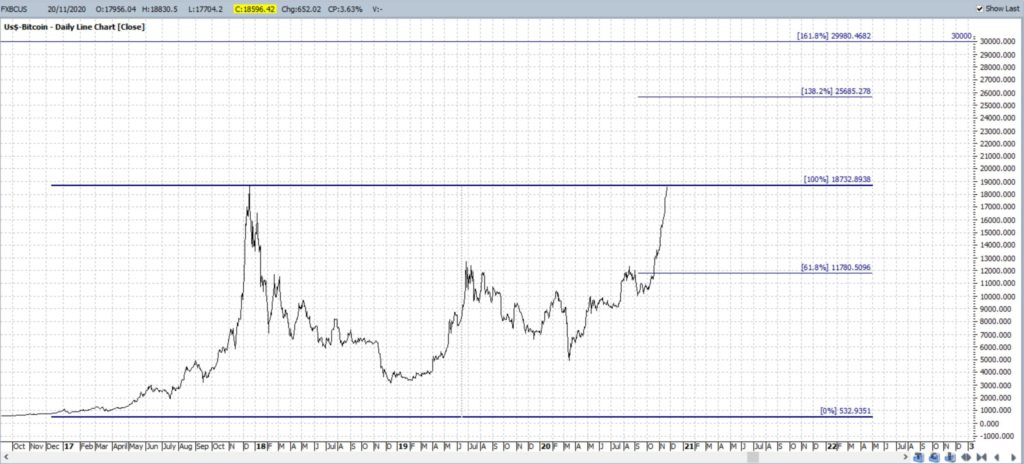
BTC/USD: The recovery of BTC/USD over recent weeks has brought this cryptocurrency back into focus for many traders and analysts. BTC/USD closed the week with a large bullish weekly candle and just under the $19,000 whole-number S/R level. I have long been on record wondering if this 2019 – current swing High move is part of a Wave 3 style Elliott move and that thought remains valid. The weekly chart is also shaping up with a potential bullish pattern and any breakout with this pattern would support my Wave 3 thesis.
BTC/USD: is this swing High part of a Wave 3 style thrust?
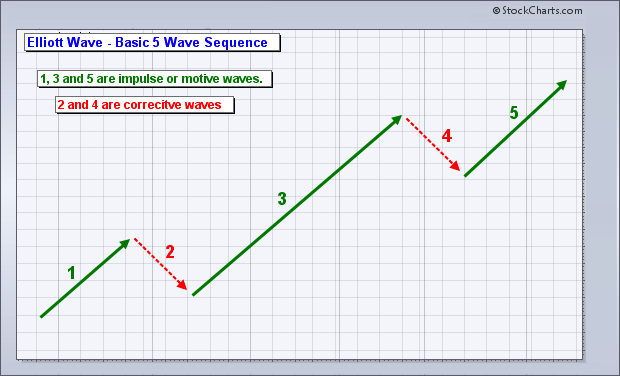
The Wave 3 of the Basic 5 wave Elliott pattern is the longest of all the waves, as illustrated below, and so is well worth monitoring:
Elliott Wave (courtesy of Stockcharts.com):
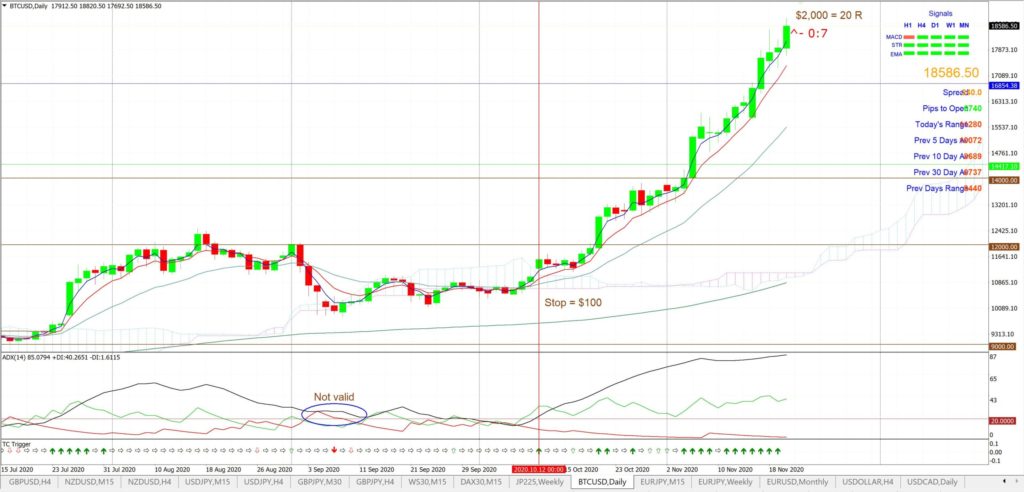
Note how the ADX and Ichimoku Cloud would have helped traders to capture this latest swing High move off the daily chart. The TC signal here have a 20R trade result that is still open:
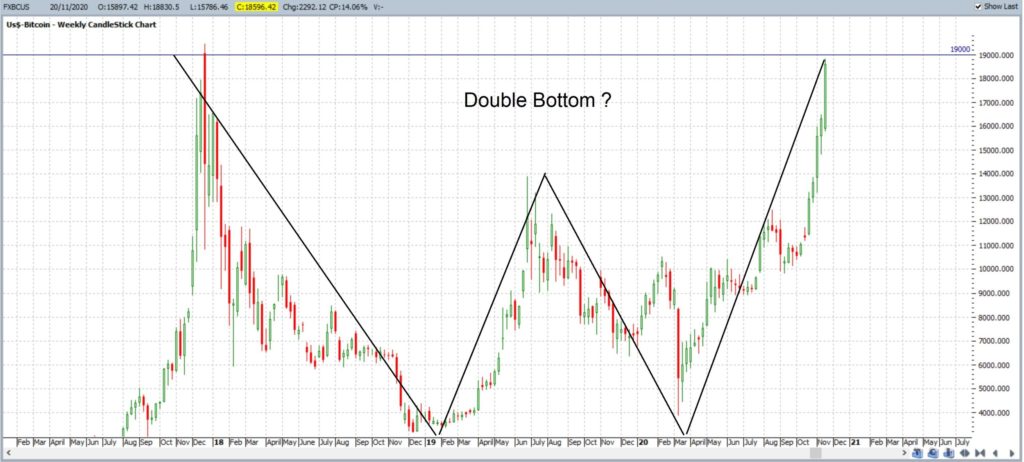
The weekly chart below has a bit of a bullish-reversal Double Bottom look to it doesn’t it! Many technical analysts would have the $14,000 as the neck line here but $19,000 looks like the next prominent resistance level to monitor. Traders should watch the $19,000 level for any new make or break:
Any BTC/USD weekly chart break and hold above $19,000 would bring the $30,000 level into focus as this is the 161.8% Fibonacci extension of the last swing High move (2017-2018):


