Over the weekend I was asked a question about a triangle breakout on the 15 min chart of BTCUSD and whether the negative ADX set up would have precluded this trade idea. Here are my thoughts and observations. You may benefit from my article on the ADX, if you are not familiar with this indicator, as it forms a significant part of the analysis.
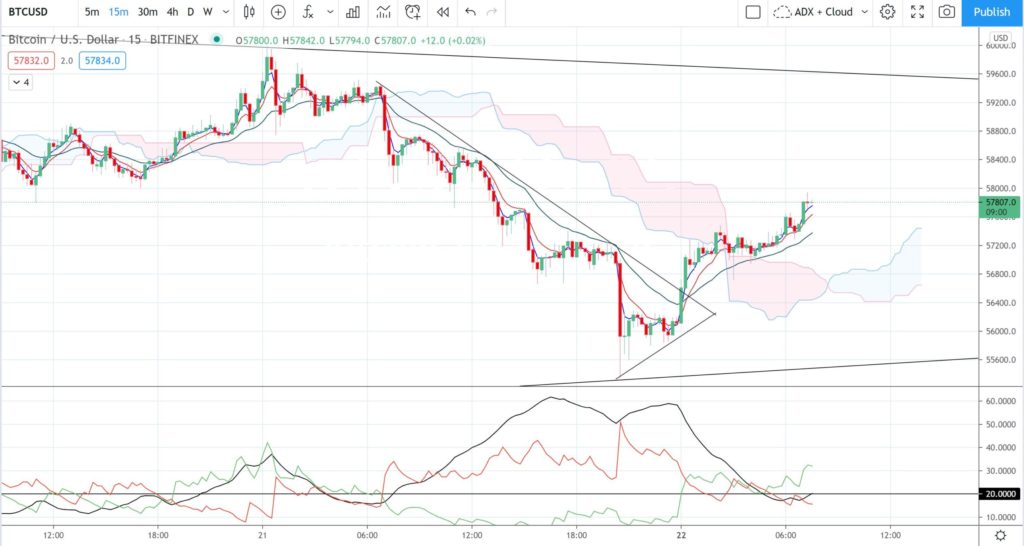
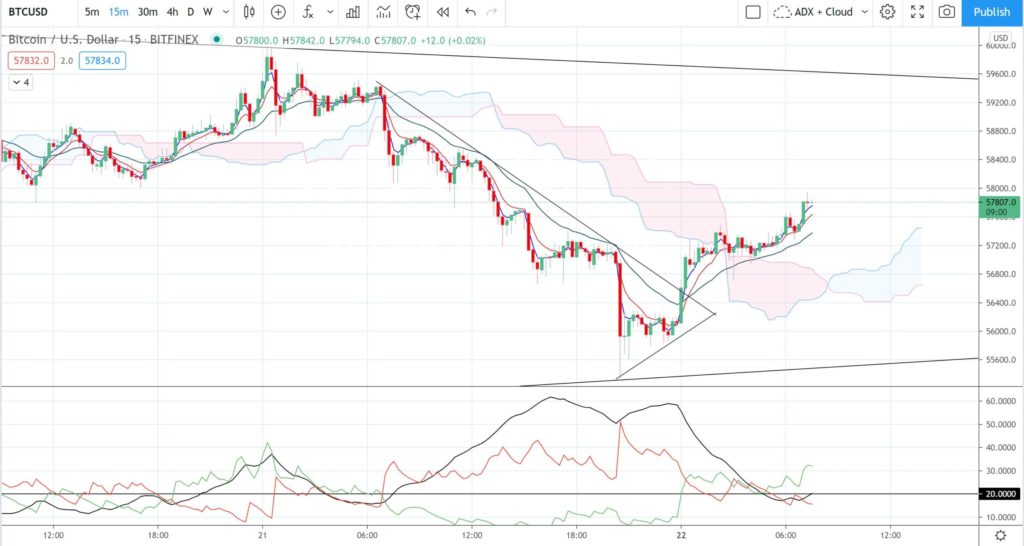
BTC/USD 15 min chart: this was the triangle breakout in question and here was the question: with the adx being above 20, but declining, and the dx+ breaking above 20 at the time of the breakout. In your experience, are these trades usually ok to still take?
I’ll come back to this in a moment but, as with any chart analysis, I never start by just looking at this time frame in isolation. I always approach from a top down perspective; looking at the longer term charts and then drilling down to lower time frames.
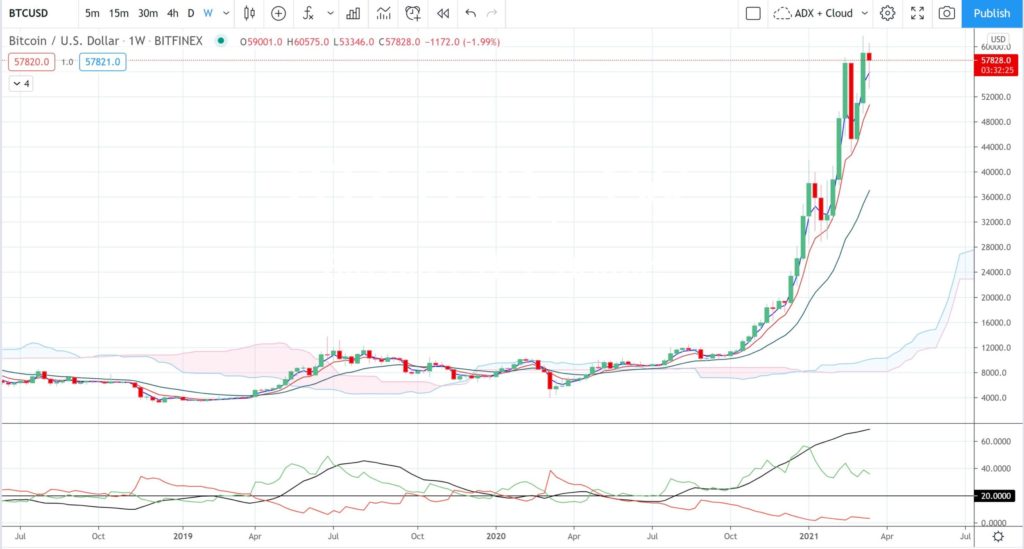
BTC/USD weekly: I note the long bullish run for BTC/USD BUT the recent print of a bullish-reversal style Hanging Man candle. Is this any guarantee of a reversal? No, but it would help to keep me open-minded about the prospect of, at least, a potential pause.
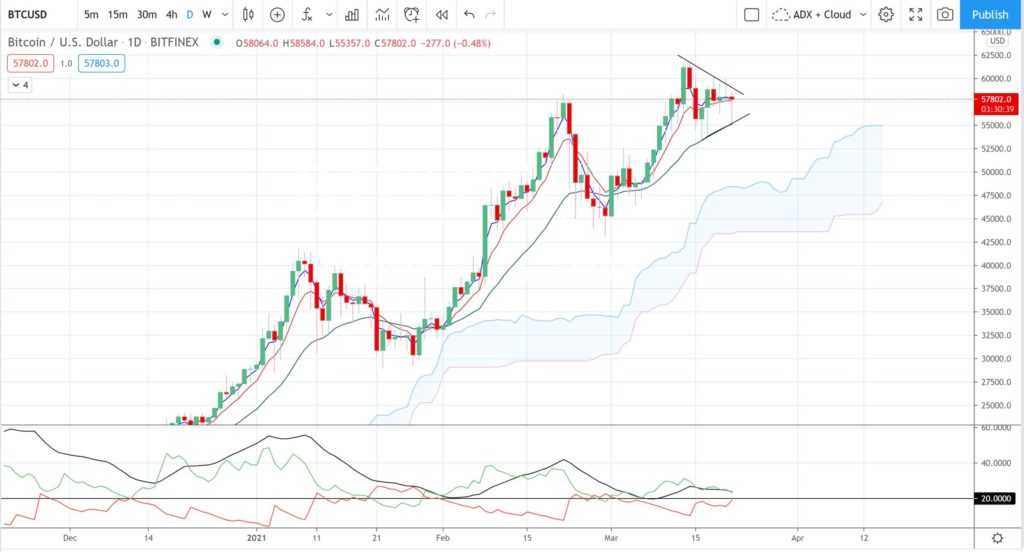
BTC/USD daily: I note the congestion here on the daily time frame and on fairly low momentum. Note how the ADX (black line) is hovering just above the 20 threshold.
BTC/USD daily with divergence: I also note some bearish divergence on the daily chart time frame. That is, price is going up but bullish momentum ( +DMI: green line) is going down. Again, is this any guarantee of what is to come? Of course not, but, it’s just another warning to keep an open mind.
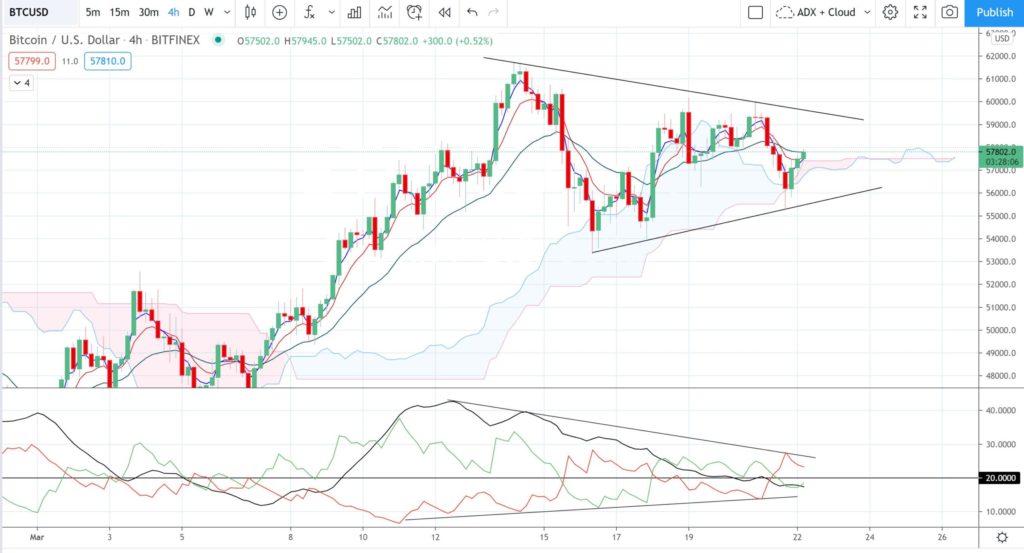
BTC/USD 4hr: I note the sideways congestion on the 4hr chart has even less momentum. The ADX (black line) is below the 20 threshold and is edging lower. Note, also, the contracting and declining momentum:
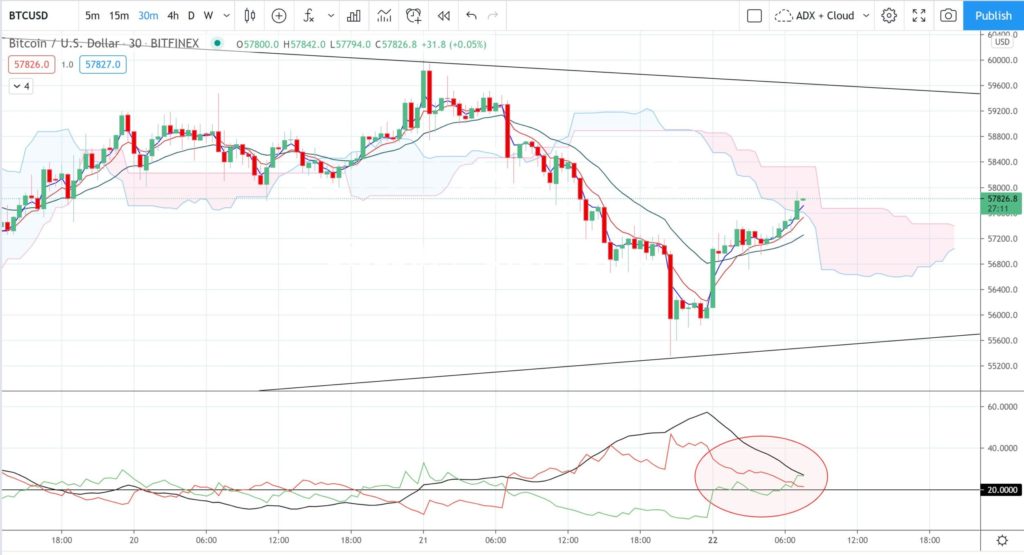
BTC/USD 30 min: price action is edging higher but it is currently in the congestion of the 4hr Cloud. I note that overall ADX momentum is still declining BUT that bullish + DMI momentum is edging upwards:
BTC/USD 15min: this was the 15 min chart triangle breakout that was in question. Would this have been a good signal on this time frame? My answer is ‘no’ given that:
- price was below the 15 min Cloud
- the ADX was declining, even though it was above the 20 threshold.
Also, where would you place your STOP if you did take this trade? Below the bottom triangle trend line? In my opinion yes, that is where you would need it placed.
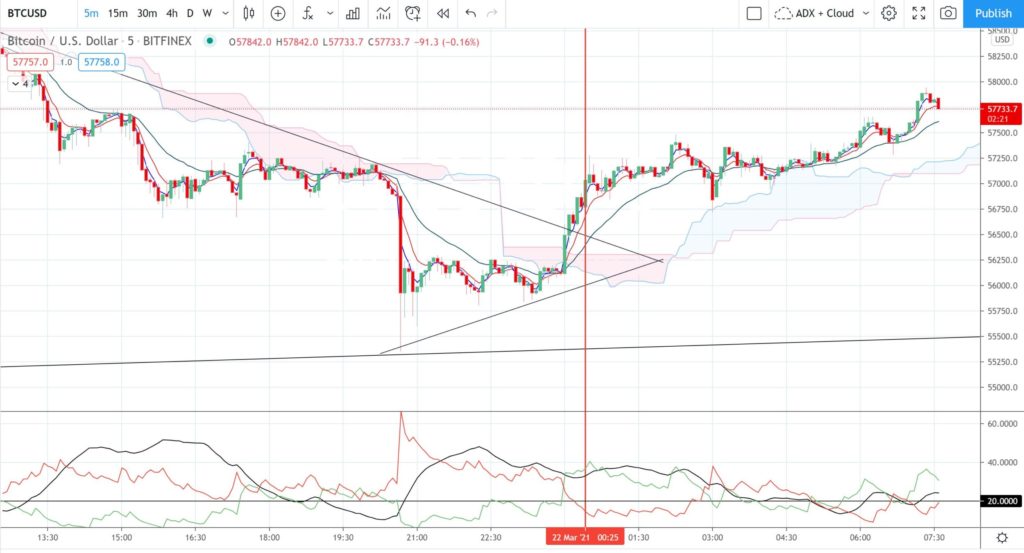
Is that the end of the story? No, this trade may not have been a decent set upon the 15 min time frame but, if this is your focus pair, then maybe look at a lower time frame that usually, not always, can present with a lower risk profile. That is, go down to the 5 min chart.
BTC/USD 5 min: the 5 min chart was a better time frame for assessing this particular breakout. I have place a vertical line through the candle that would have been, in my opinion, a decent signal.
The setup at this candle was deemed appropriate as:
- price action had broken out and above the triangle trend line.
- price action was above the 15 min Cloud.
- The ADX was above 20 and rising.
- The +DMI was above 20 and rising.
- The -DMI was below 20.
One advantage of dropping down to this frames is that you can reduce your RISK for this trade. Your STOP could have been placed just below the 5 min Cloud. This reduces your risk a bit compared to a trade taken off the 15 min chart.
Final thoughts:
It may seem like this approach is retro curve fitting but really, the key here is to have a set of clearly defined rules and to stick to them, whatever time frame you wish to work from.
In my opinion the key to successful trading is:
- Develop a trading strategy that gives you an edge: that is, better than a coin toss. Use can this guide as a framework to get you started.
- Have a well defined trading plan that documents this trading strategy.
- Manage you RISK and keep this to an acceptable percentage of your overall trading account.
- Exercise this trading plan with discipline.
- repeat steps 1-4.


