It has been four years now since I posted about the triangle breakouts on the S&P500 and DJIA indices and this post is an update on the progress of those breakouts and subsequent ones on the NASDAQ and Russell-2000.
S&P500:
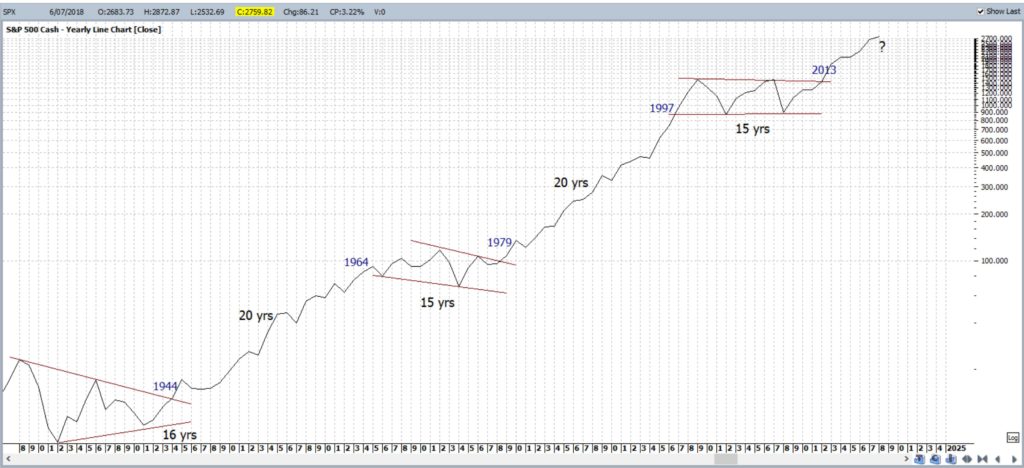
S&P500 multi-year Log chart: I am keeping an open mind with this index but there is a clear pattern developing here still:
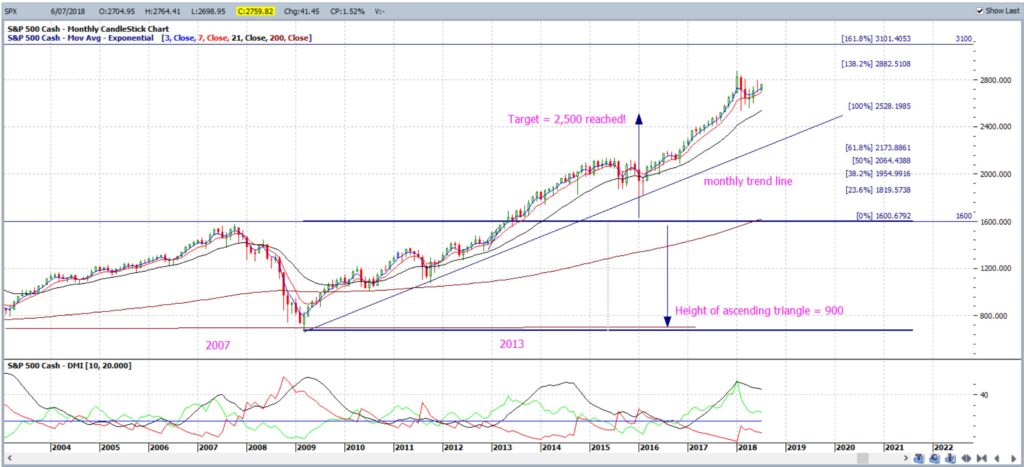
S&P500 monthly: The Fibonacci Extension on the move from 2009 to the breakout in 2013 shows that the 100% extension has been achieved and the next major level is 161.8%; near 3,100. This is an obvious target if bullish action continues and price action passes the previous High.
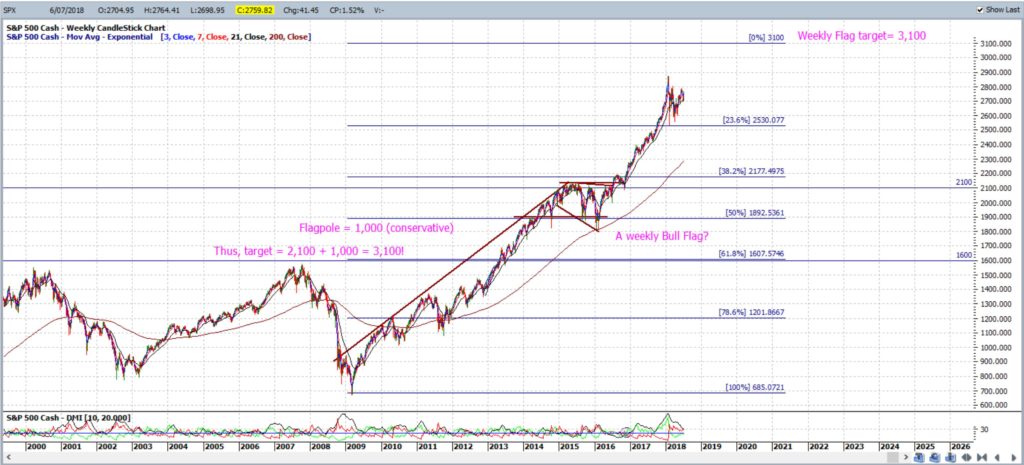
S&P500 weekly: It is interesting to note that the 3,100 target is also derived from this weekly chart Bull Flag pattern! Confluence!
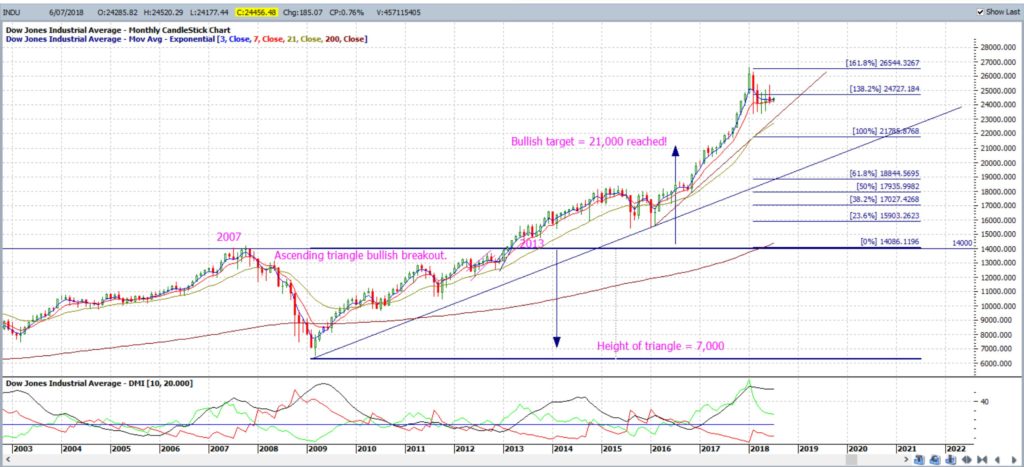
DJIA monthly: The Fibonacci Extension of the move from 2009 to the breakout in 2013 shows that the 100% extension has been achieved and the next major level is the 161.8% level where price has already peaked. This level is near 27,000 and would make a good target if bullish action continues. Any further continuation would then bring the 200% extension into focus.
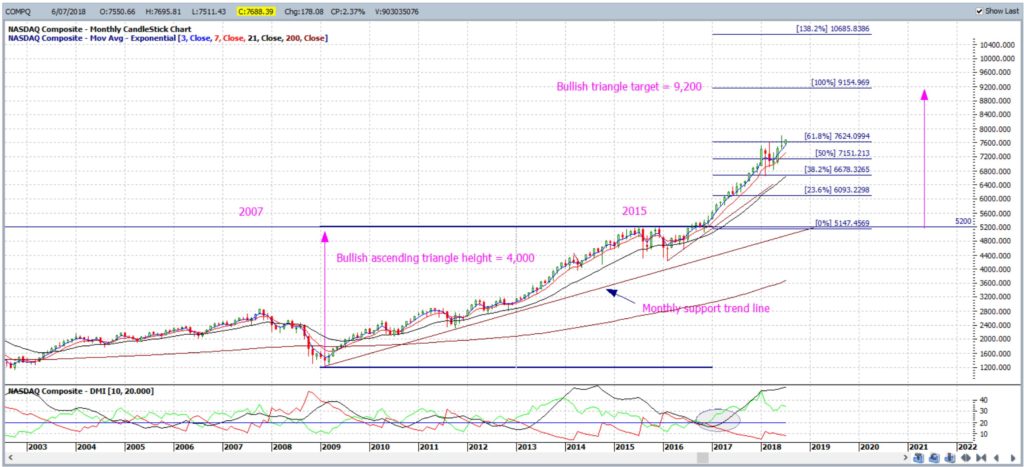
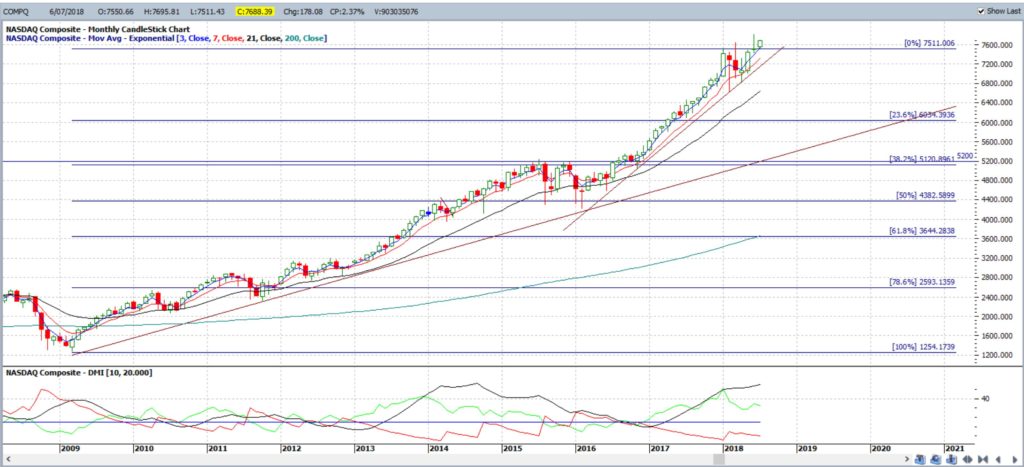
NASDAQ monthly: The Fibonacci Extension of the move from 2009 to the breakout in 2016 shows that price action is attempting to break up through the 61.8% level, near 7,600, Any continuation would bring the 100% level into focus, near 9,200, and this also happens to be the monthly chart’s ascending triangle breakout target.
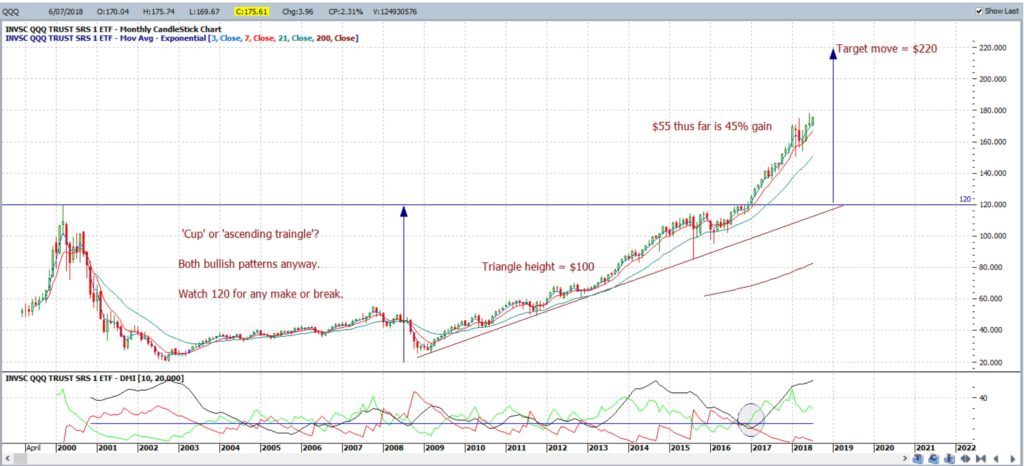
QQQ monthly: This triangle breakout on the NASDAQ-100 ETF is still in progress and currently up 45%.
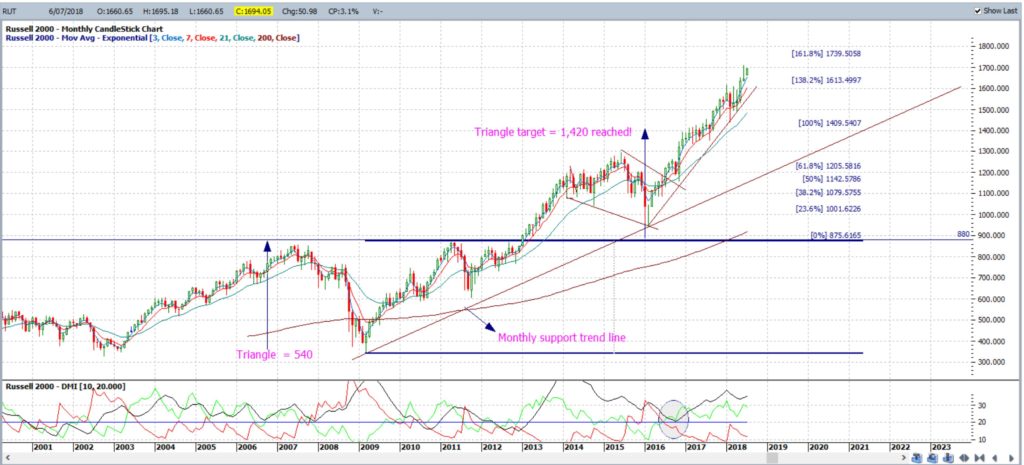
Russell-2000 monthly: The Fibonacci Extension of the move from 2009 to the breakout in 2013 shows that the 100% extension has been achieved and the next major level is the 161.8% level, near 1,740 . This would make an obvious target if bullish action continues.
Summary: The four major US stock indices, the S&P500, DJIA, NASDAQ and Russell-2000, are all continuing on from their bullish monthly triangle breakouts. The bullish-continuation levels that are in focus on the following indices are summarised below:
- S&P500: the 161.8% level and this is near the 3,100 level.
- DJIA: the 161.8% level, where price has already peaked, near 27,000.
- NASDAQ: the 100% level near 9,200.
- Russell-2000: the 161.8% level which is near the 1,740 level.


