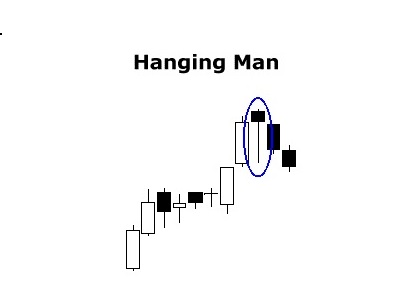
The four major US stock indices, S&P500, DJIA, NASDAQ and Russell-2000, closed the month of February by printing bearish-reversal Hanging Man style candles. The four indices are holding above two-year support trend lines for now but some healthy respect, at a minimum, would be prudent given the print of these bearish monthly candles. In this post I note key patterns, trend lines and levels to monitor on the four indices in coming sessions.
The Hanging Man candle is a signal of potential bearish reversal. It is characterised by a candlestick with a small body and long lower shadow that forms on exhaustion at the top of an uptrend. Whilst there is no guarantee of a reversal it is a sign of hesitation and should be respected. Traders would be wise to watch out for further signals of weakness by way of continued bearish candle prints and break of support trend lines:
S&P500:
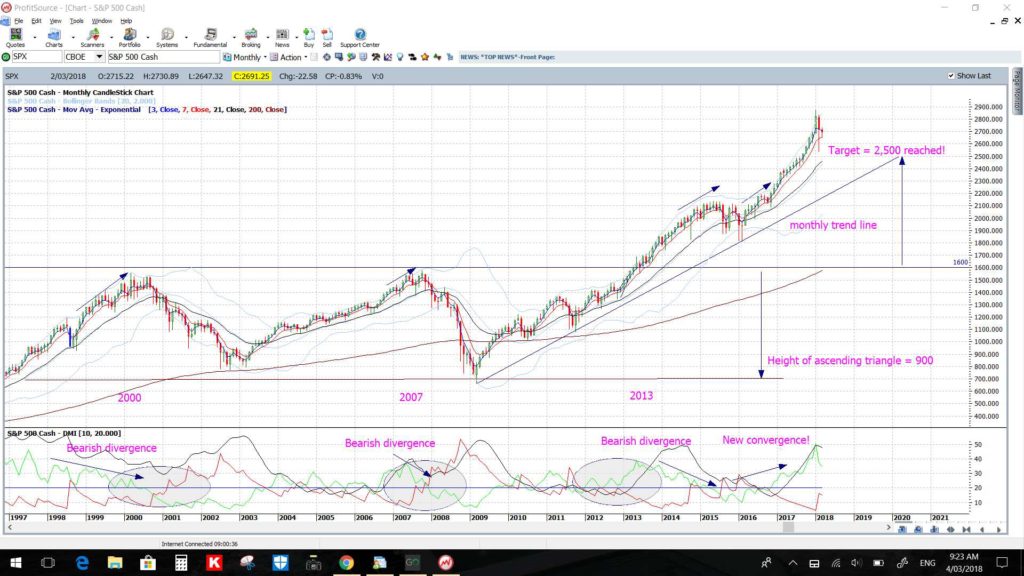
S&P500 monthly: The ascending triangle breakout move completed some months ago and there has been a large bearish candle printed for February; the first of such size in over over two years. In fact, there have only been 6 bearish candles printed in the last 24 months and the other five bearish candles were small Spinning Tops or Dojis!
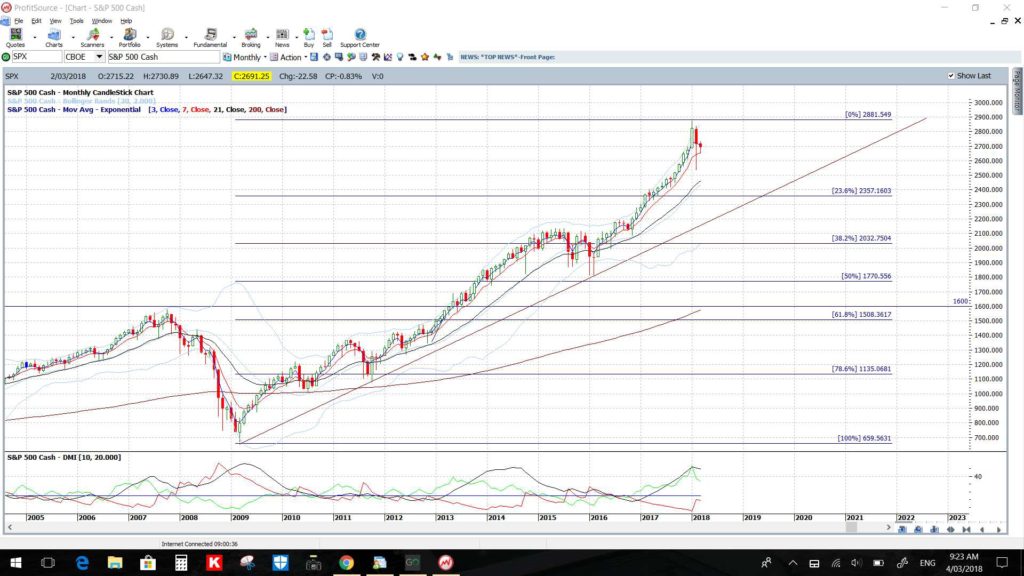
S&P500 monthly: Placing Fibonacci retracement on the swing high since the 2008 GFC shows that the 61.8% fib level is down near 1,600 and this is a very significant level. The 1,600 level was the previous High and ascending triangle breakout level and this region would be in focus on any serious and deeper pullback:
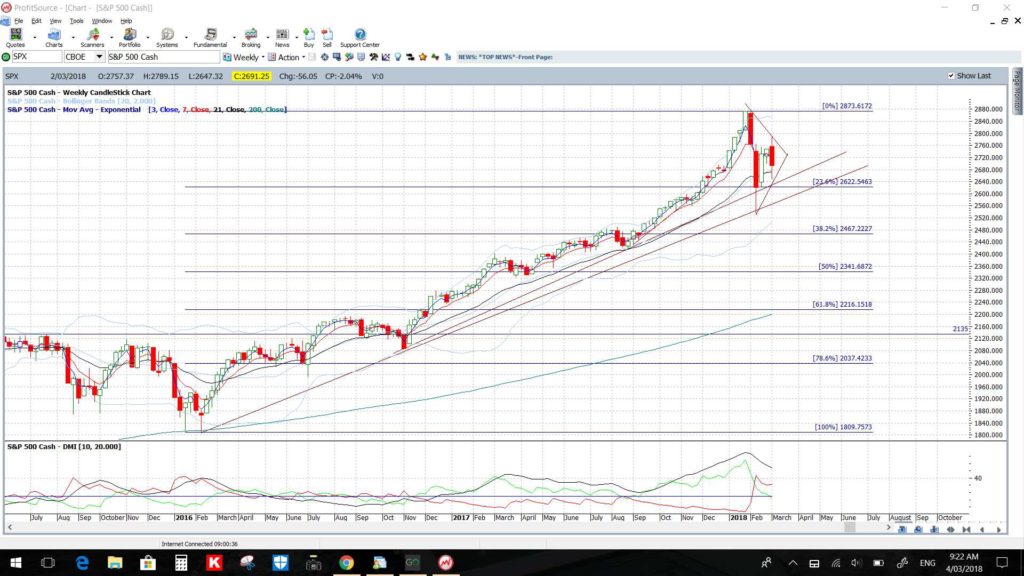
S&P500 weekly: The first point to note on this chart is that the index has yet to close below a range of support trend lines and price action is currently consolidating in a Flag pattern that could well go on to be a Bull Flag. So, despite some volatility and wild daily moves, price action is not even ugly yet; ugly is yet to come, if at all!
Placing Fibonacci retracement on the last swing high move since 2016 shows that the 61.8% fib level is down near 2,200 and this is near the weekly 200 EMA and just above another S/R level of 2,135. This would be the region to watch if bearish momentum develops and the trend lines are broken.
DJIA:
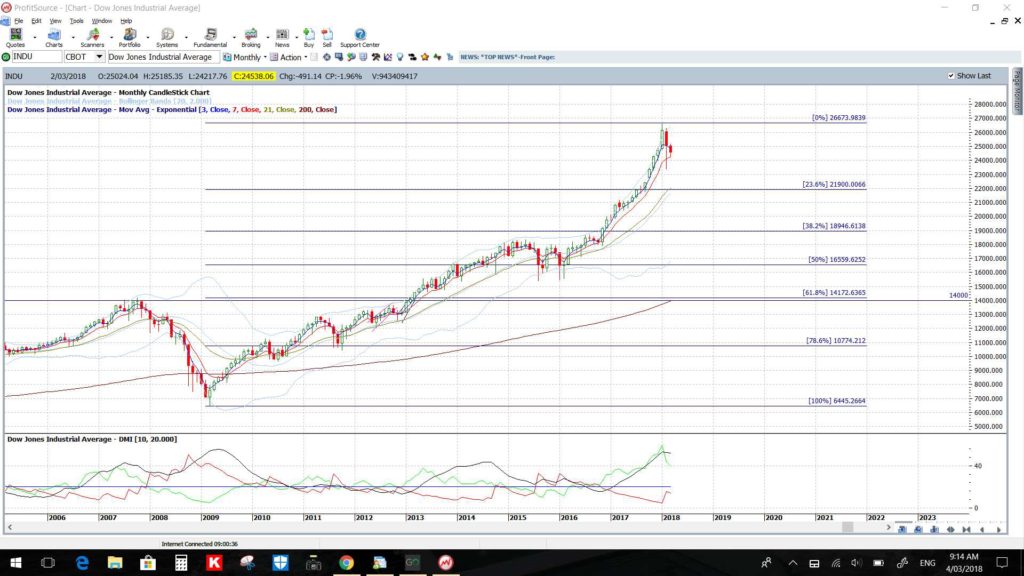
DJIA monthly: As for the S&P500, the ascending triangle breakout move completed some months ago and there has been a large bearish candle printed for February; the first of such size in over over two years. Here, also, there have only been 6 bearish candles printed in the last 24 months and the other five bearish candles were small Spinning Tops or Dojis!
DJIA monthly: Again like the S&P500, placing Fibonacci retracement on the swing high since the 2008 GFC shows that the 61.8% fib level is down near 14,000 and this is a very significant level. The 14,000 level was the previous High and ascending triangle breakout level and would be in focus on any deeper pullback:
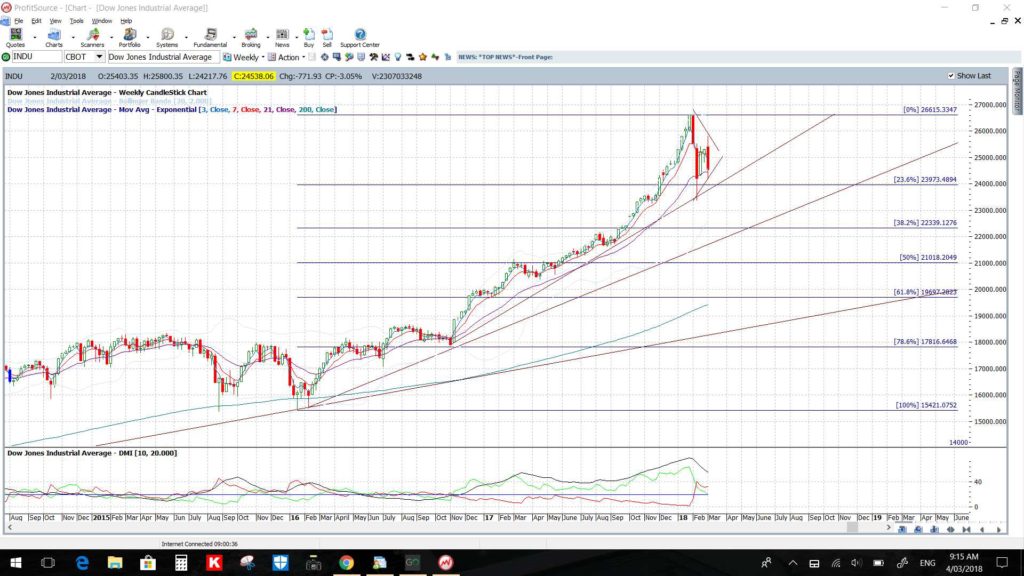
DJIA weekly: And like the S&P500 again, the first point to note on this chart is that the index has yet to close below a range of support trend lines and price action is consolidating in a Flag pattern that could well go on to be a Bull Flag. So, despite some volatility and wild daily moves, price action is not even ugly yet either and ugly is yet to come, if at all!
Placing Fibonacci retracement on the last swing high move since 2016 shows that the 61.8% fib level is down near the 20,000 whole-number and psychological level and this is also near the weekly 200 EMA. This would be the region to watch if bearish momentum develops and the upper two trend lines are broken.
NASDAQ:
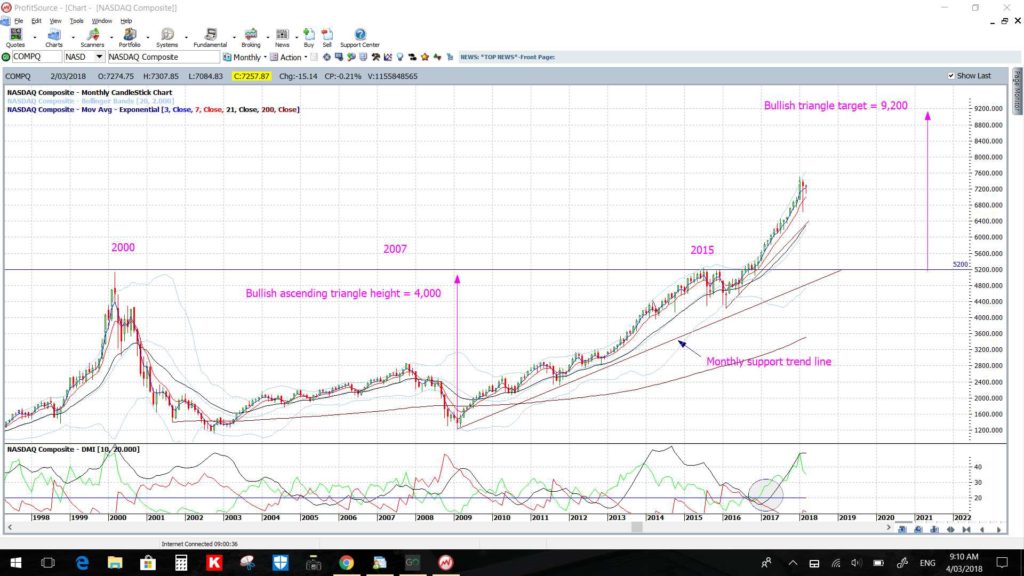
NASDAQ monthly: Unlike the S$P500 and DJIA, the NASDAQ has yet to complete its ascending triangle breakout and has only printed 5 bearish candles out of the last 24 months and all were candle with small bodies.
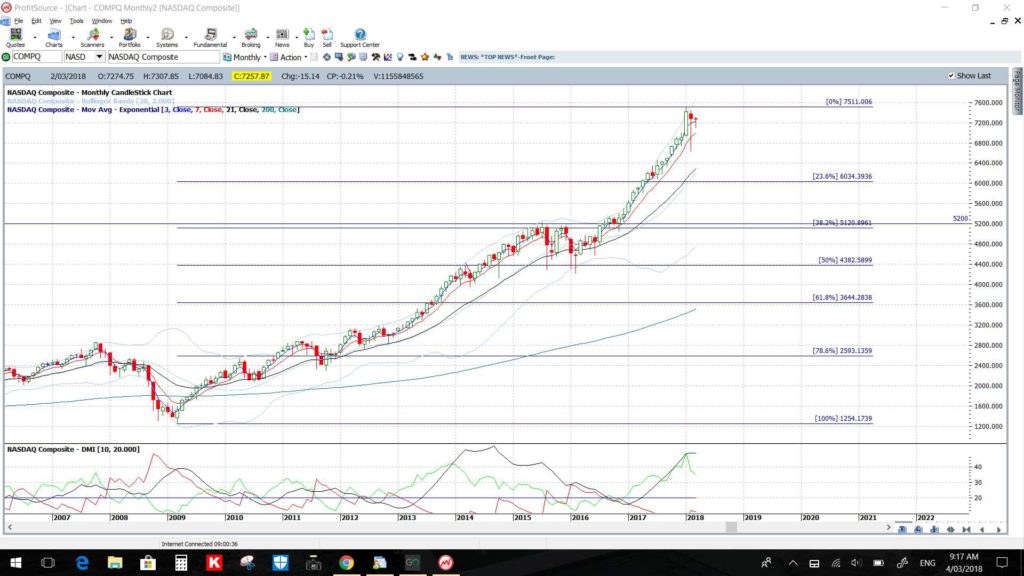
NASDAQ monthly: Placing Fibonacci retracement on the swing high since the 2008 GFC shows that the 61.8% fib level is down near 3,600 which is below the ascending triangle breakout level but near the monthly 200 EMA:
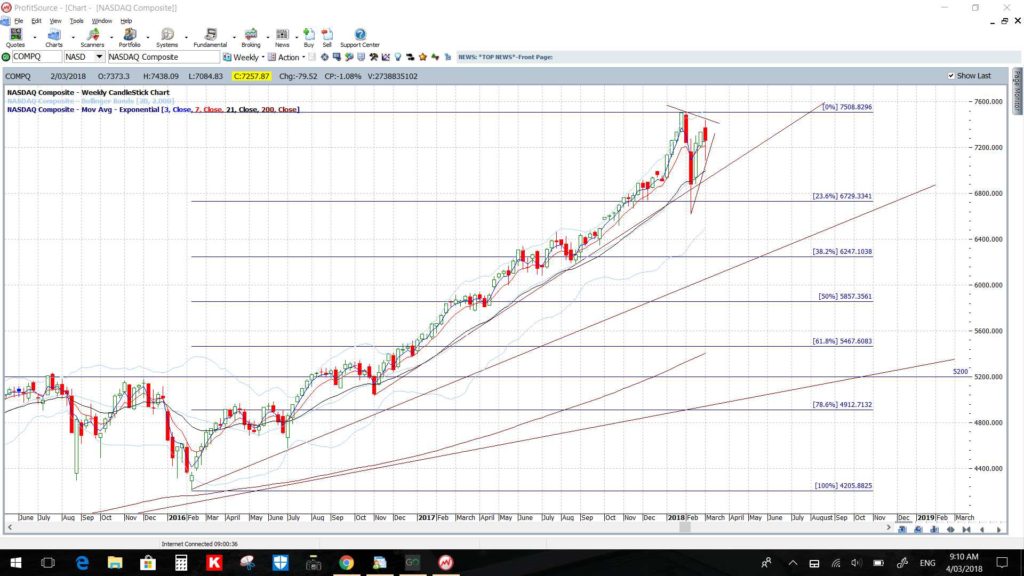
NASDAQ weekly: Of note here also is the fact that the index has yet to close below a range of support trend lines and price action is also consolidating in a Flag pattern that could also well go on to form a Bull Flag. So, despite some volatility and wild daily moves, price action is not even ugly yet either and ugly is yet to come, if at all!
In this instance, placing Fibonacci retracement on the last swing high move since 2016 shows that the 61.8% fib level is down near the ascending triangle breakout level of 5,200 and is also near the weekly 200 EMA. This would be the region to watch if bearish momentum develops and the upper two support trend lines are broken.
Russell-2000:
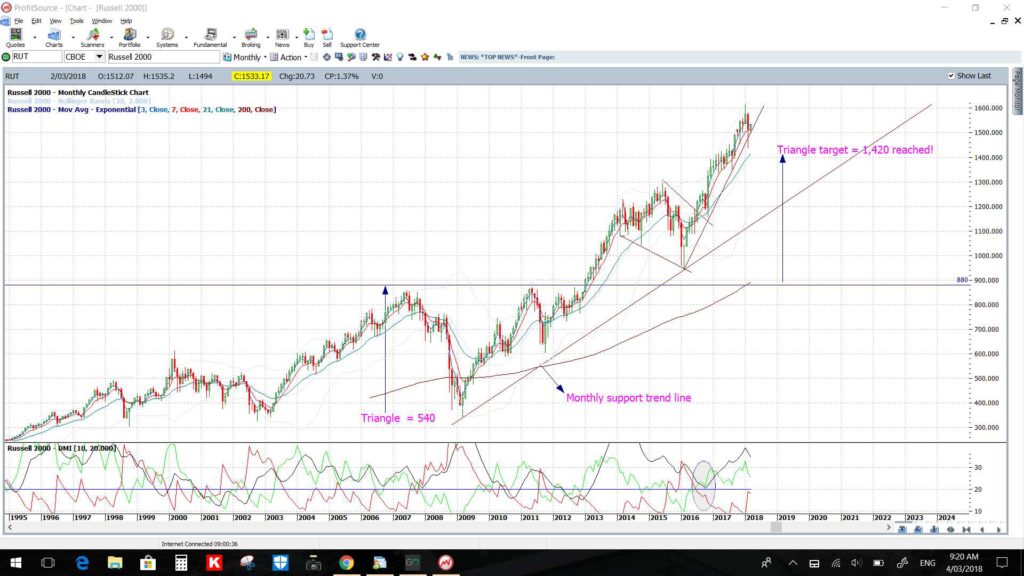
Russell-2000 monthly: Like with the S&P500, the ascending triangle breakout move completed some months ago and there has been a large bearish candle printed for February. On this index there have been 8 bearish candles printed in the last 24 months with six of them being small Spinning Tops or Dojis!
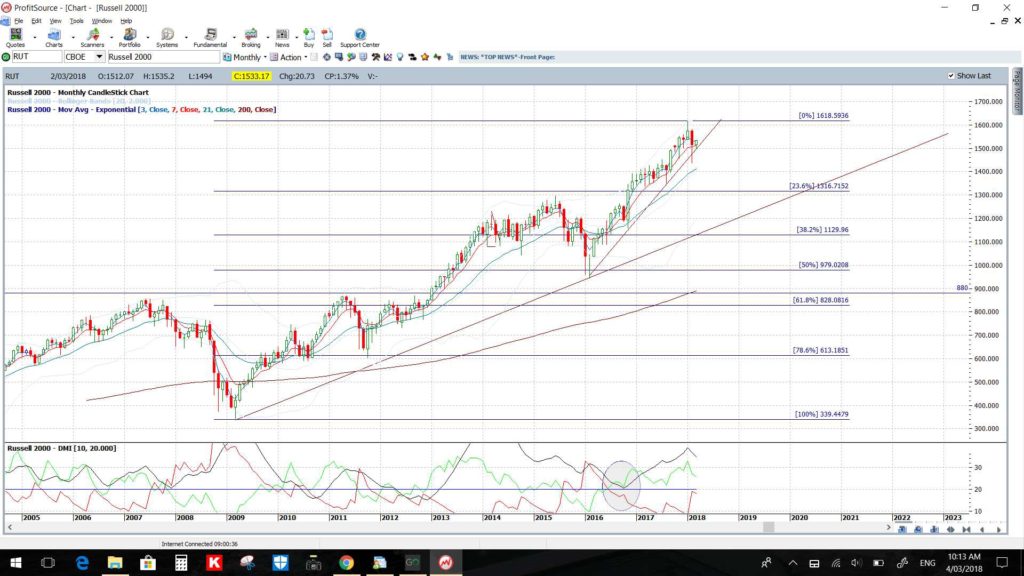
Russell-2000 monthly: Again, like the S&P500, placing Fibonacci retracement on the swing high since the 2008 GFC shows that the 61.8% fib level is down near 880 and this is a very significant level. The 880 level was the previous High and ascending triangle breakout level and would be in focus on any deeper pullback:
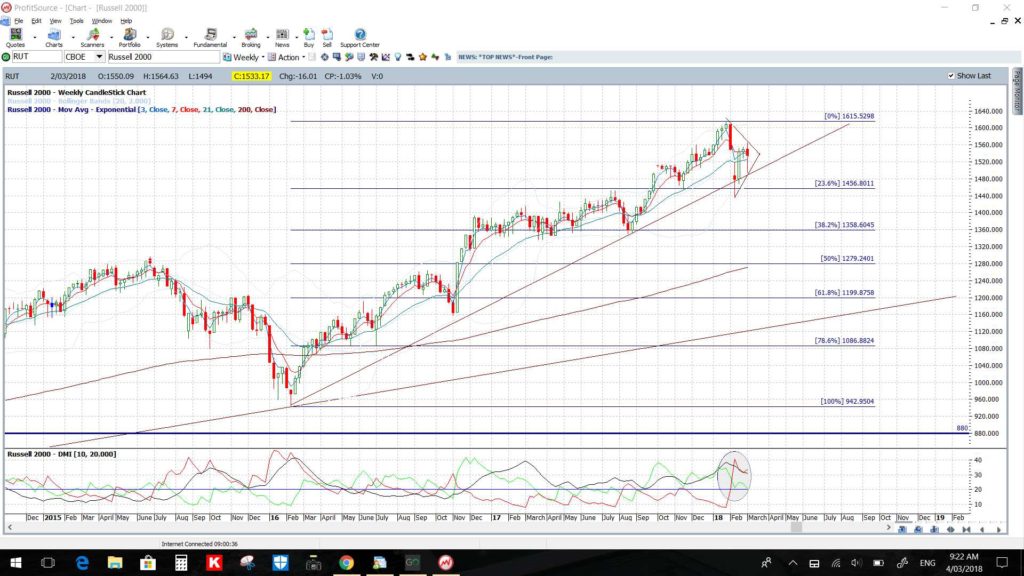
Russell-2000 weekly: As with the S&P500, the first point to note on this chart is that the index has yet to close below two key support trend lines and price action is also consolidating in a Flag pattern that could well go on to be a Bull Flag. So, here again, despite some volatility and wild daily moves, price action is not even ugly yet and, as with the other indices, ugly is yet to come, if at all!
Placing Fibonacci retracement on the last swing high move since 2016 shows that the 61.8% fib level is down near 1,200 and this is also not to far from the weekly 200 EMA. This would be the region to watch if bearish momentum develops and the upper support trend line is broken.


