Wed 30th July
This article is a follow up article to one posted back on July 6th 2014. The earlier article dealt with the coincidence of identical bullish targets on both the S&P500 and DJIA being derived from two completely different calculations.
These targets on both the S&P500 and DJIA are still valid but the issue remains as to when, if ever, we might see a pull back and, also, whether there will be a pull back before any possible bullish continuation? Thus, I consider that I have the Y axes fairly well sorted, with bullish targets and pull back levels identified for both indices, BUT the timing of these events, the Y axis, is the one that remains all elusive. Until recently I hadn’t been able to fathom any global event(s) that could trigger a deep stock pull back. The development of Geo-political tension across the Middle East/Gaza and the Ukraine however may prove to be just the trigger. These situations, along with that of ISIS in Iraq, are most troubling and continue to gather momentum that have the potential to undermine market confidence.
In the space below I recap the bullish and pull back targets for both the S&P500 and DJIA with updated charts. I also look over a number of other global indices to see if I can gather any clues from them.
Recap of bullish and pull back targets for S&P500 and DJIA:
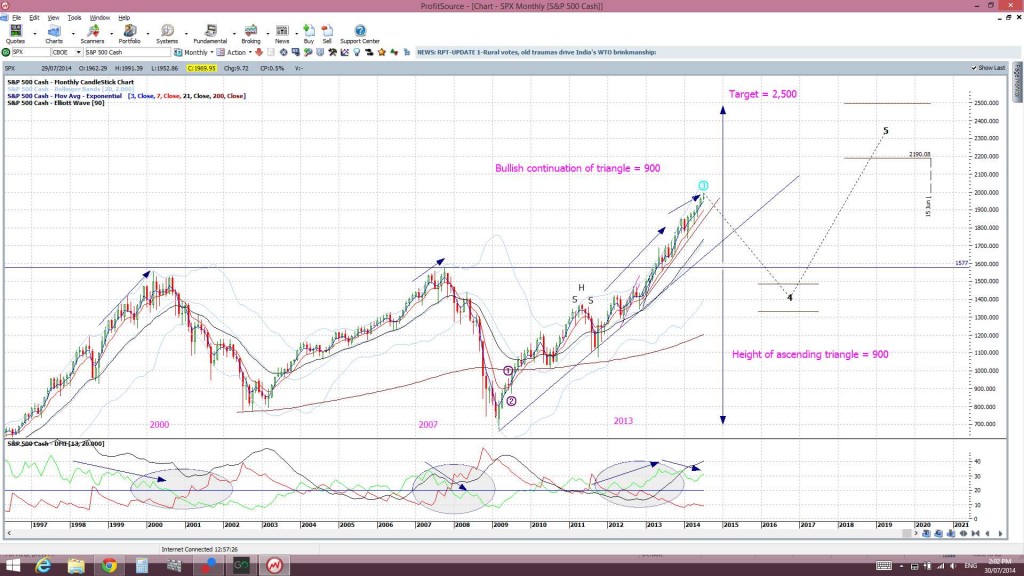
S&P500: the S&P500 made a bullish ascending triangle breakout on the monthly chart time frame back in April 2013. Potential targets for such breakouts are calculated from the height of the triangle pattern. The height of the pattern for the monthly S&P500 ascending triangle was 900. This was calculated from the move of 700 to approximately 1,600. Thus, the target for any potential bullish continuation could be expected to reach as far as 900 above the 1,600 breakout level. This would give a possible target of 2,500:
S&P500 monthly
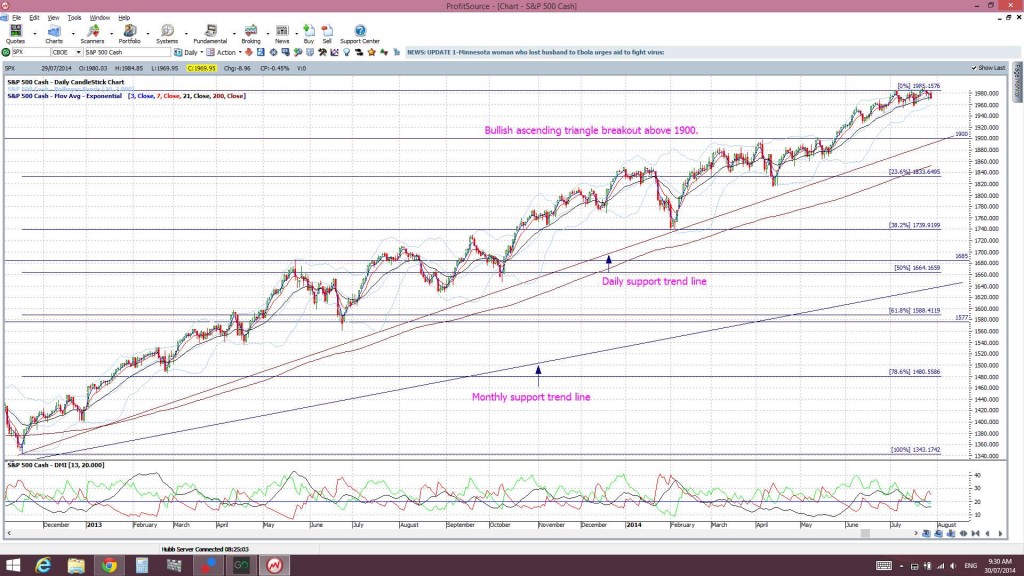
Elliot Wave theory suggests a pull back before such a target might be reached. I would expect that any break of the daily and weekly support trend lines might see the S&P500 pull back to near the 61.8% fib level of the latest bull move. This level happens to be near the previous monthly breakout level of 1,577 and is shown on the daily chart posted below.
The S&P500 has been rather bullish since April 2013 and formed up within a smaller bullish ascending triangle pattern on the daily chart as well. There was a recent breakout from this triangle when price broke up through the 1,900 level:
S&P500 daily
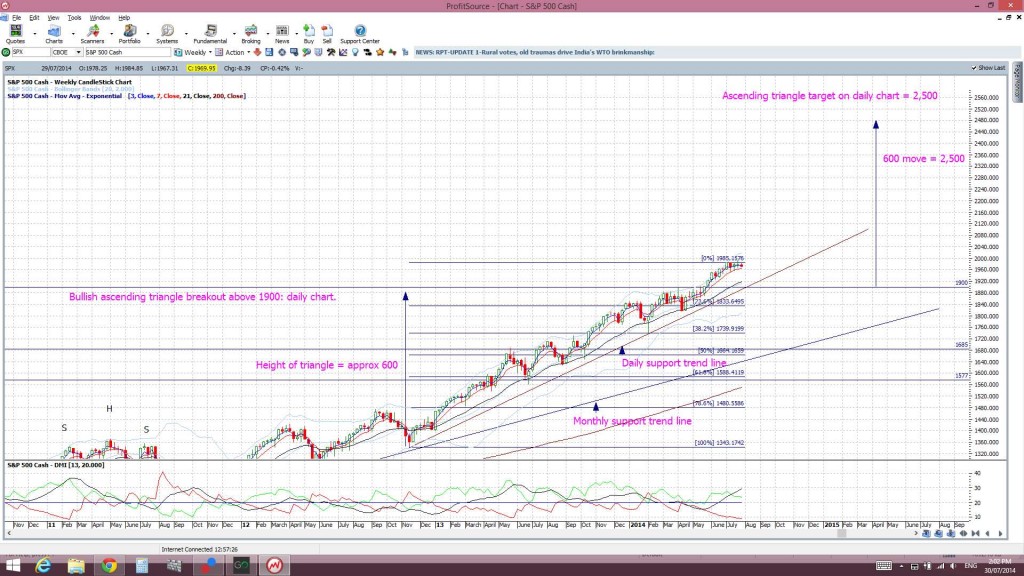
I then calculated possible bullish targets for this smaller triangle breakout to see how it compared to the monthly chart target. The same maths applied here. The height of this smaller daily chart triangle was 600. This was calculated from a move of roughly 1,300 to 1,900. Thus, the target would be 600 above the 1,900 level. This projects a possible target for any bullish continuation at 2,500:
I found this parallel quite fascinating but also rather reassuring. The larger monthly chart ascending triangle breakout and the smaller daily chart ascending triangle breakout on the S&P500 both have the same possible targets of 2,500.
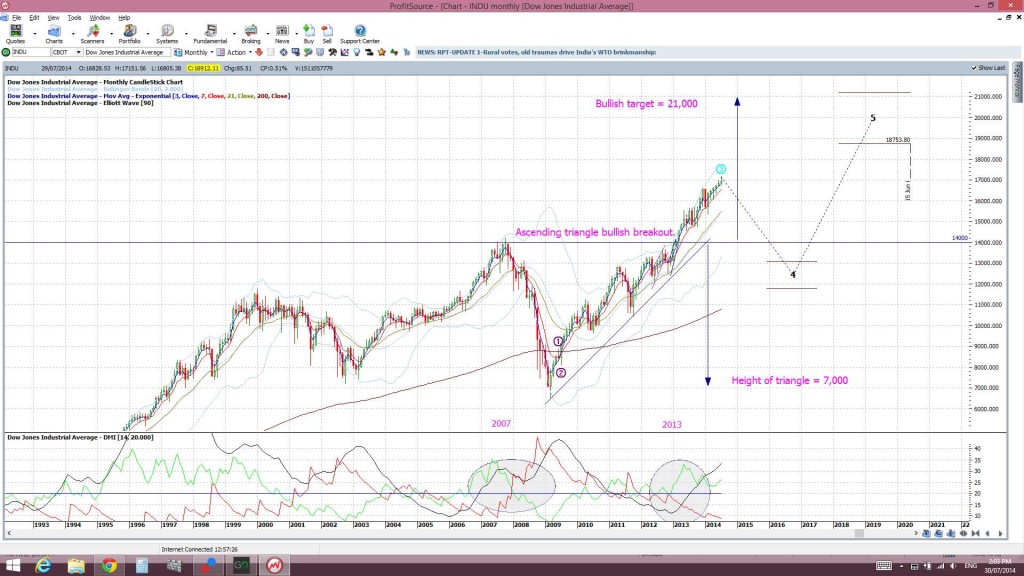
DJIA: It didn’t stop there with the S&P500 though. The DJIA also made a bullish ascending triangle breakout back in March 2013:
DJIA monthly
Using the same mathematical logic here the height of this monthly ascending triangle was about 7,000. This was calculated from the move of 7,000 to 14,000. Thus, the possible target for any continuation could be expected to reach 7,000 above the 14,000 level. This gives a monthly chart triangle breakout target of 21,000.
Elliot Wave theory suggests a pull back before such a target might be reached here as well. I would expect that any break of the daily and weekly support trend lines might see the DJIA pull back to near the 61.8% fib level of the latest bull move. This level happens to be near the previous monthly breakout level of 14,000 and is shown on the daily chart posted below.
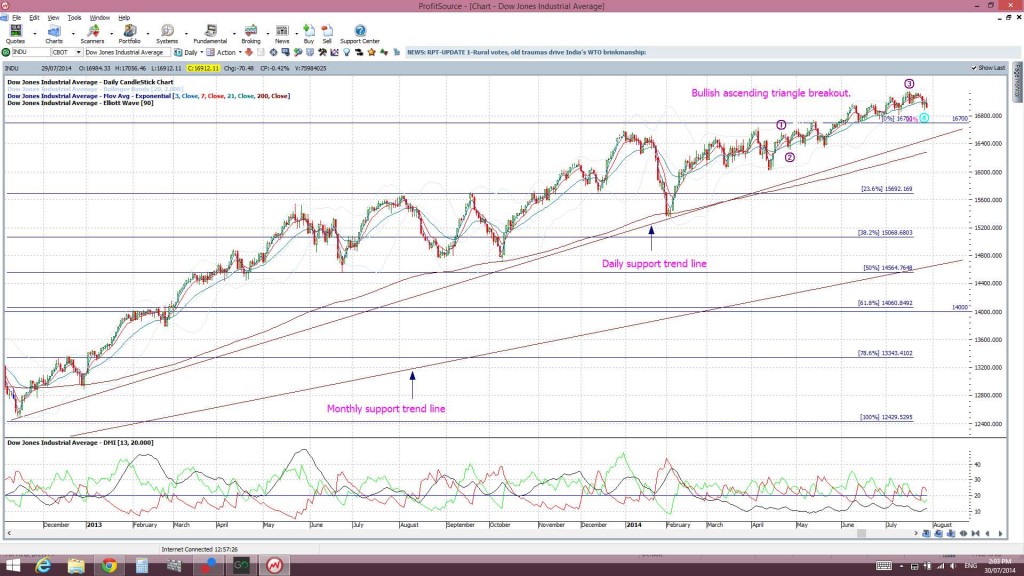
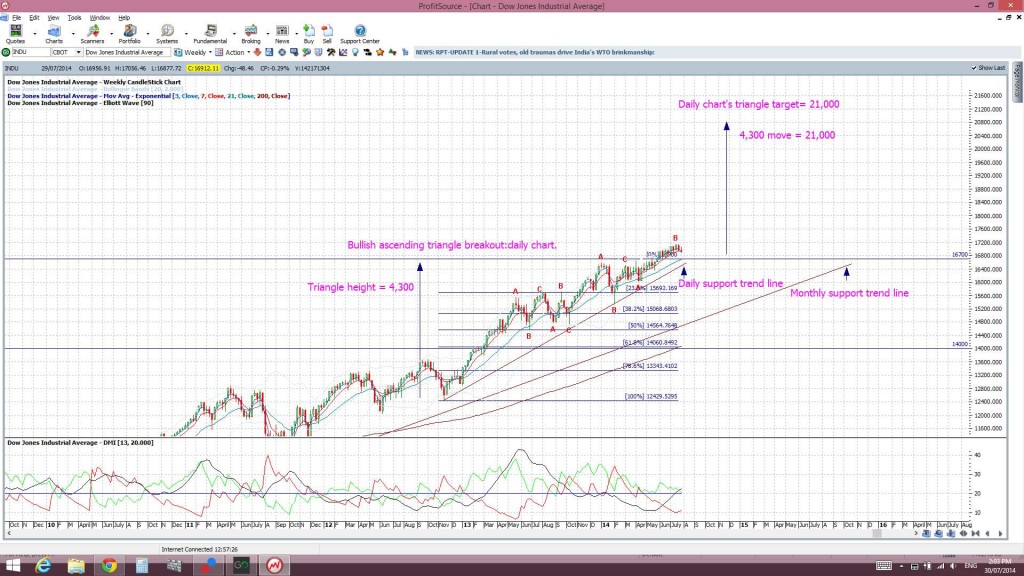
As with the S&P500, the DJIA has been rather bullish since then and formed up into a smaller ascending triangle on the daily chart as well. The index recently broke up and out of this pattern when it broke through the 16,700 level. The height of this smaller, daily chart triangle was 4,300. This was calculated from a move of 12,400 to 16, 700:
DJIA daily
The projected target then for this smaller daily chart triangle breakout would then be 4,300 points above the 16,700 level and this equates to a target of 21,000:
This is exactly the same target as for the larger ascending triangle breakout on the DJIA monthly chart!
Targets Summary: The S&P500 and the DJIA indices have made bullish ascending triangle breakouts on both their monthly and daily charts. The predicted targets for these breakouts on each index are the same whether you calculate based on the monthly chart pattern or the daily chart pattern.
- The S&P500 charts suggest 2,500 as a possible target for any bullish continuation.
- Any break of daily and weekly support trend lines on the S&P500 would have me looking at the 1,577 region as a possible pull back target.
- The DJIA charts suggest 21,000 as a possible target for any bullish continuation.
- Any break of daily and weekly support trend lines on the DJIA would have me looking at the 14,000 region as a possible pull back target.
There is no guarantee that price will follow through to these levels but this is simply an extrapolation of possible targets for any bullish continuation based on technical theory.
A check of other stock indices:
A number of other global indices are breaking out or approaching breakout levels.
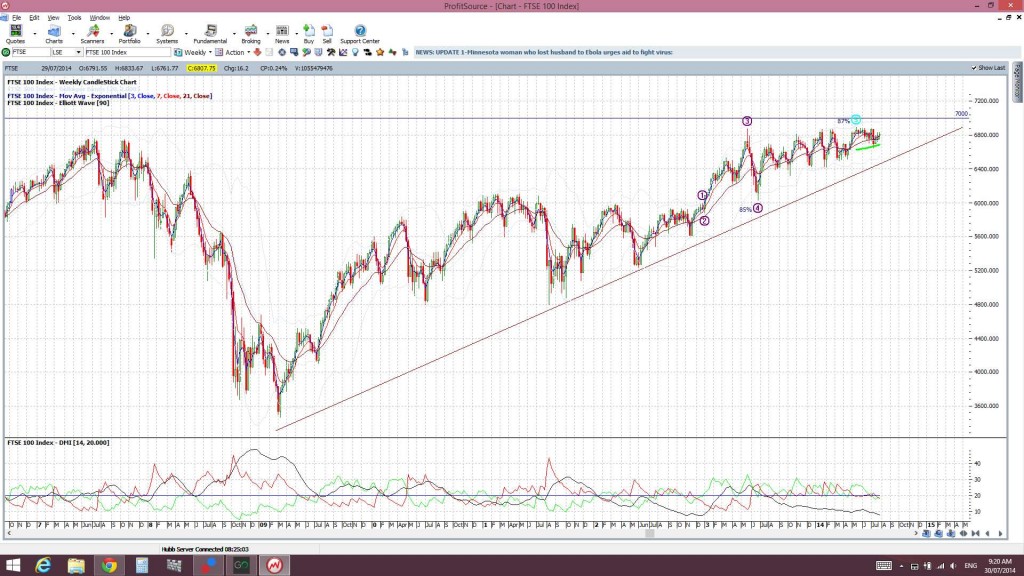
FTSE: hovering under the 7,000 breakout level:
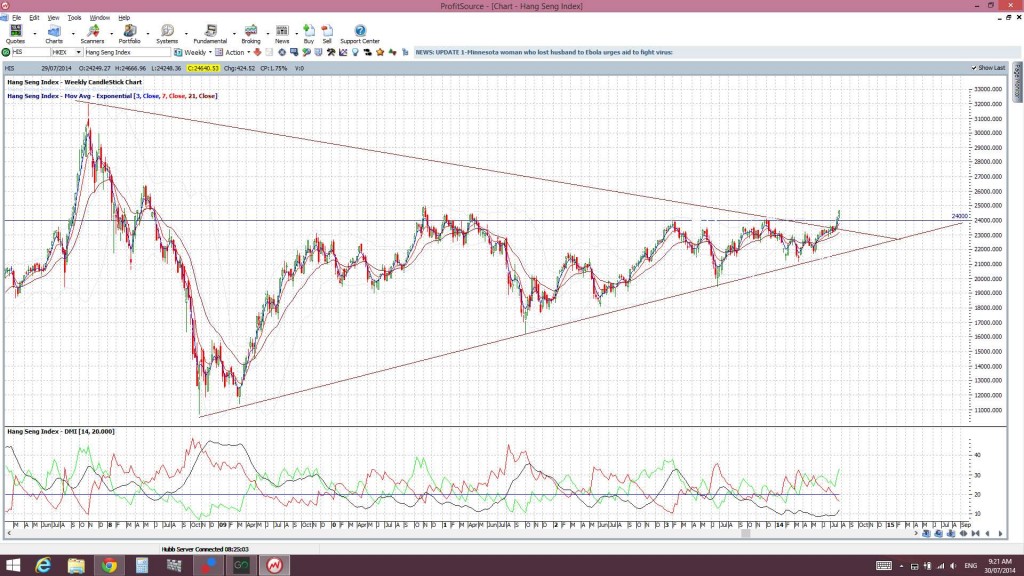
Hang Seng Index: has made a bullish triangle breakout:
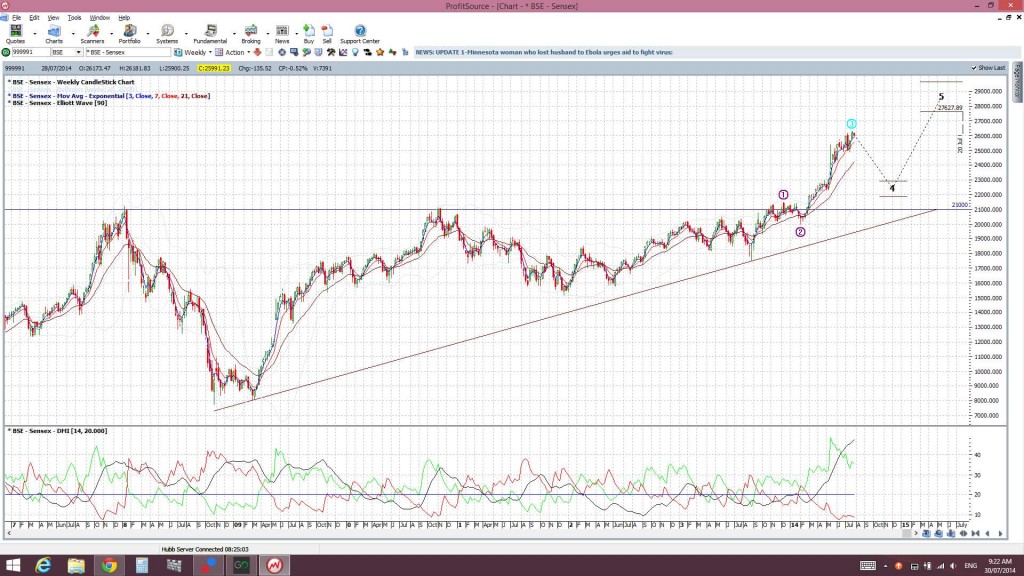
India’s SENSEX: has also made a bullish ascending triangle breakout:
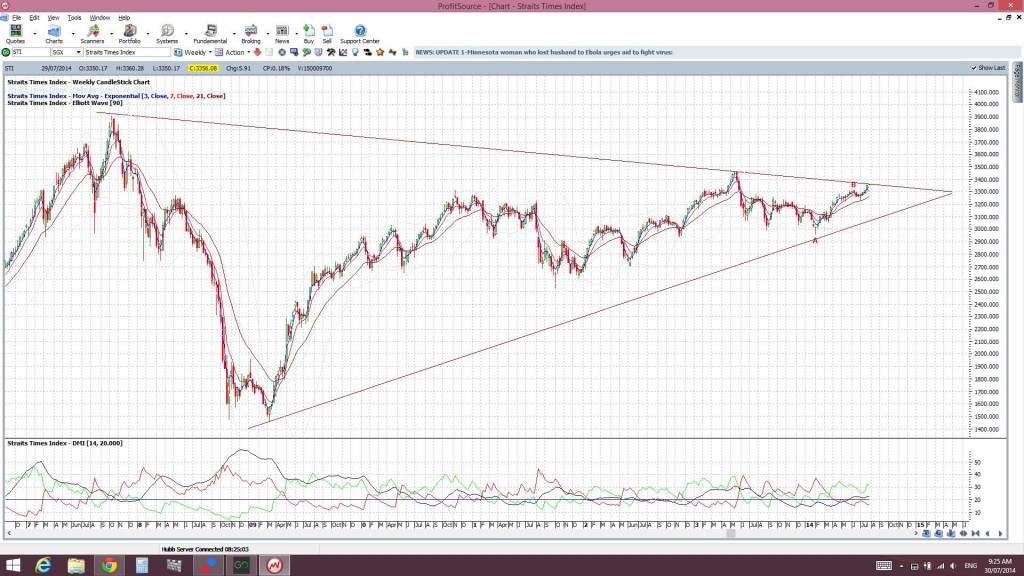
Shanghai’s: Straits Time Index: poised for a potential bullish breakout:
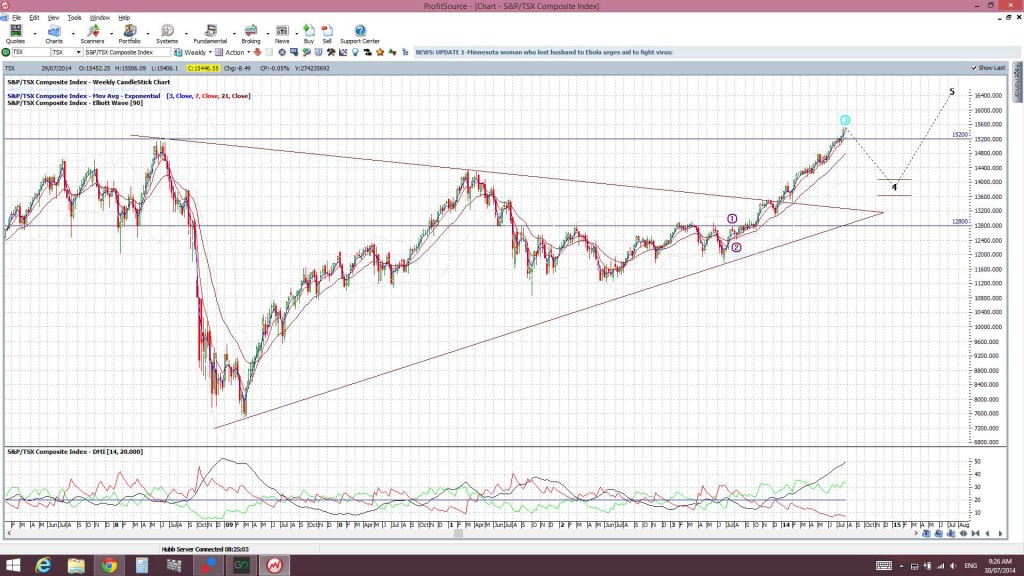
Canada’s TSX: had made a symmetrical triangle breakout and this has now been followed by a bullish ascending triangle breakout:
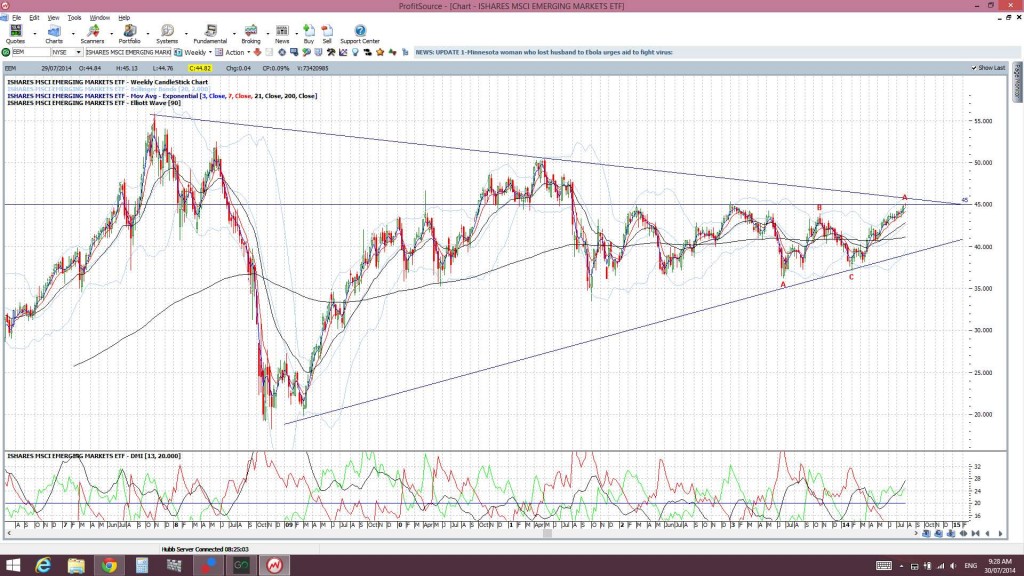
EEM: The Emerging Markets ETF continues to rally and looks set to test the triangle trend line:
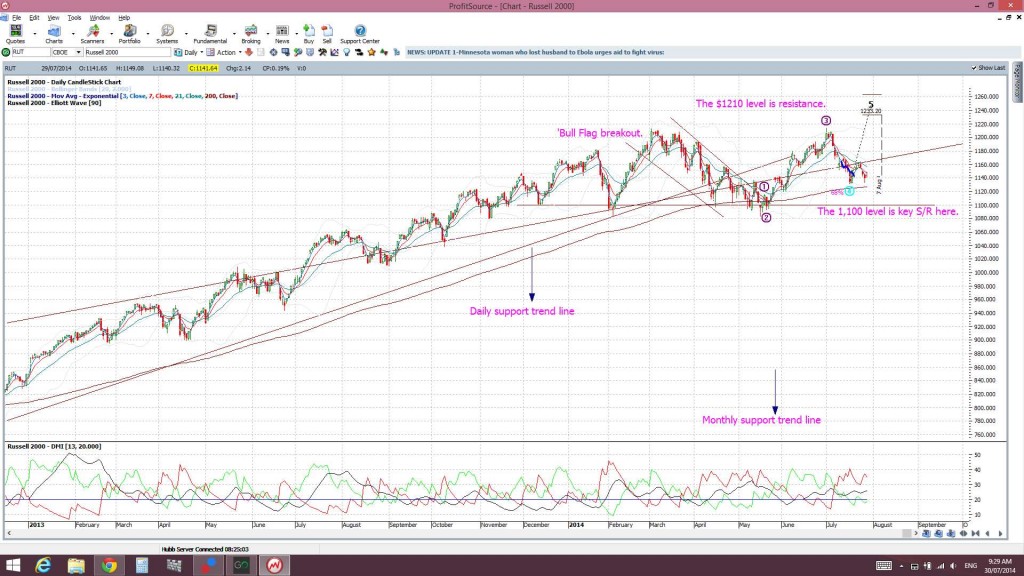
Russell 2000 ‘small caps’ index: still holding above the 1,100 support level for the time being. A breach of this level would be bearish though:
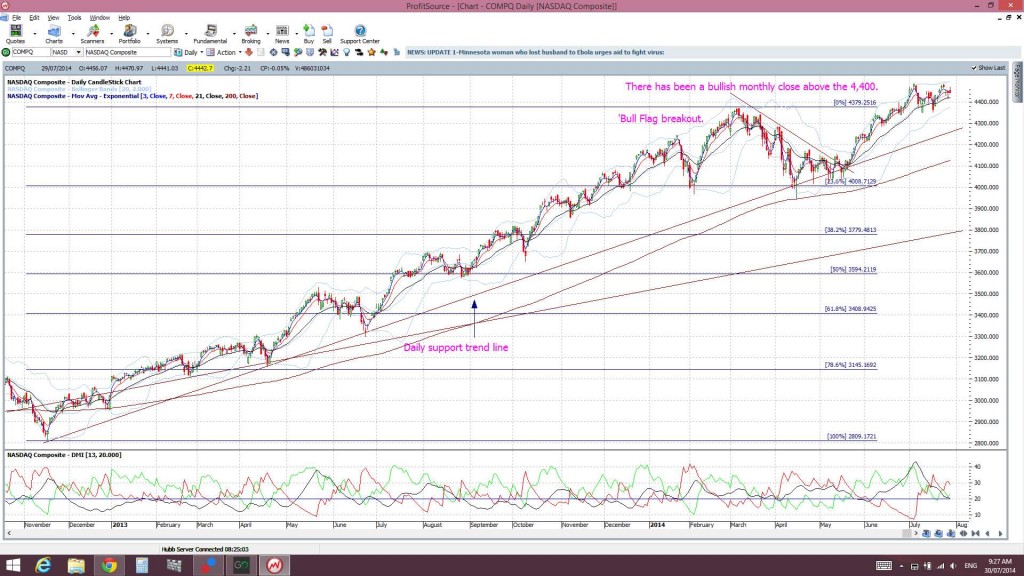
NASDAQ: holding above the 4,400 support level for now. As with the RUT, a breach of this support would be bearish:
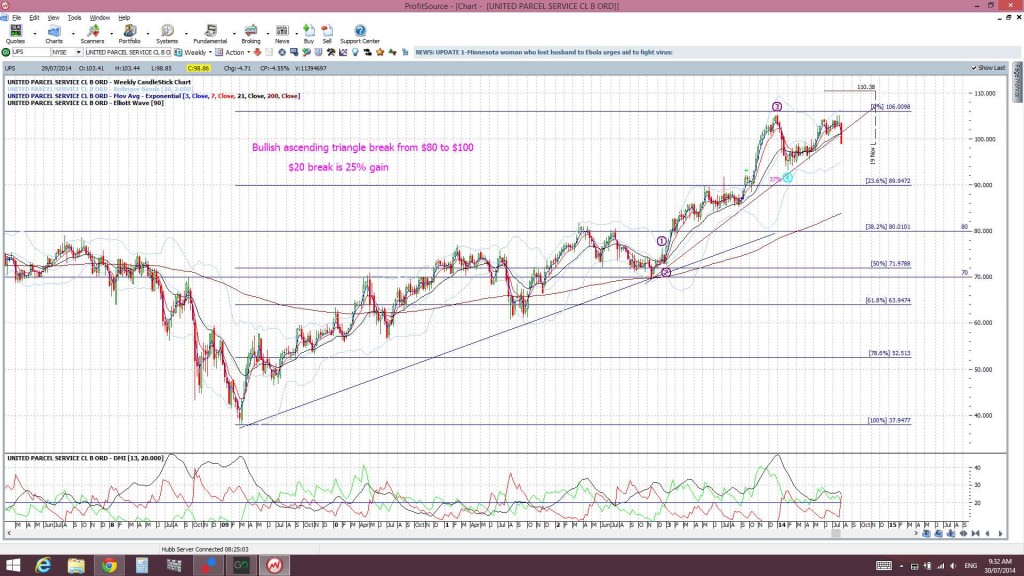
UPS: United Parcel Service; this is one ‘bellwether’ stock that has made a move below weekly support. The weekly candle has yet to close but a weekly close below this trend line would be bearish. A 38.2% fib pull back of this latest bull move would bring price back down to the $80 breakout level and would be a possible target for any deeper pull back:
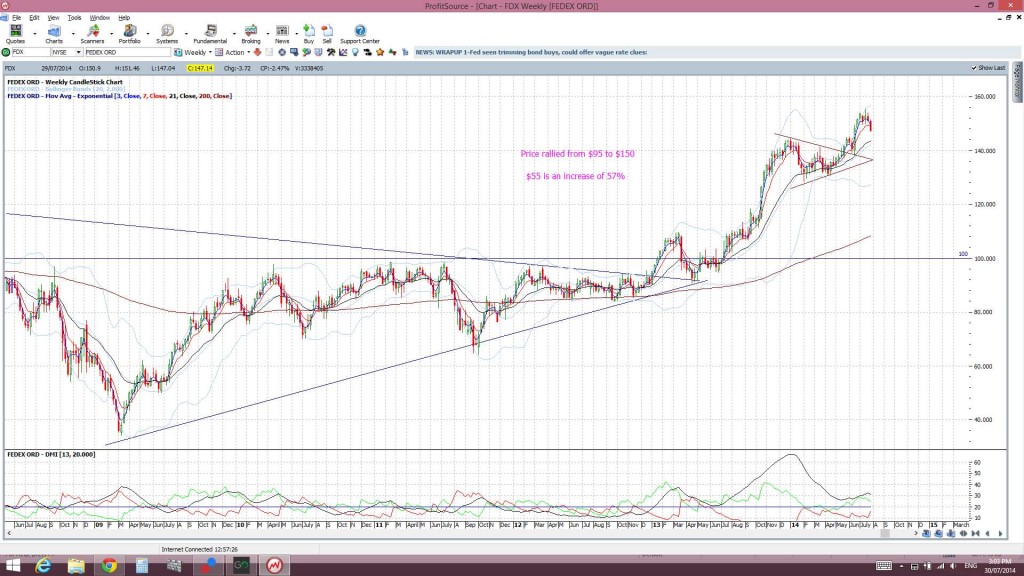
FDX: FedEx: this ‘bellwether’ also is pulling back a bit:
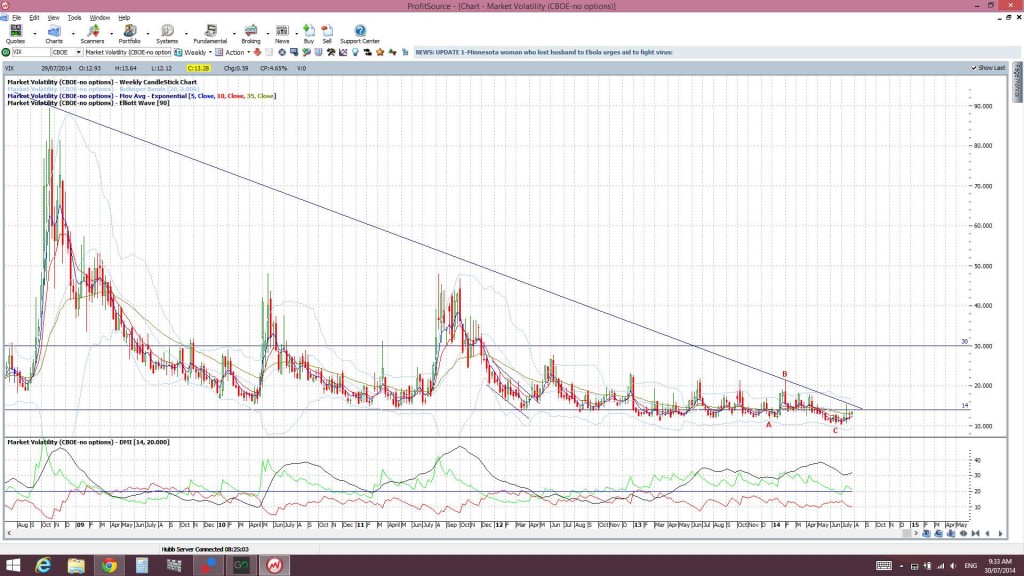
VIX: no warning bells here just yet but the potential is there for sure. Watch for any bullish break up through the bear trend line:
Conclusion: a number of global stock indices continue to make bullish moves but the current global climate has the potential to trigger a well needed pull back. Bullish and pull back, Y axis, targets have been identified for the major US stock indices of the S&P500 and DJIA. The ‘when’, or X axis, of these movements remains the mystery though.


