The S&P500 printed a bearish-reversal ‘Hanging Man’ candle for February and there has been bearish follow-through so far this March. The fear of a China – US tariff war has undermined stock market confidence over recent sessions but, when one looks over some charts, and especially the illustrious FANG charts, it seems a bit of a technical correction would not go astray anyway; no matter what the broader market conditions! In this post I look over the S&P500 and FANG charts and identify targets for any, potential, corrective move to the downside.
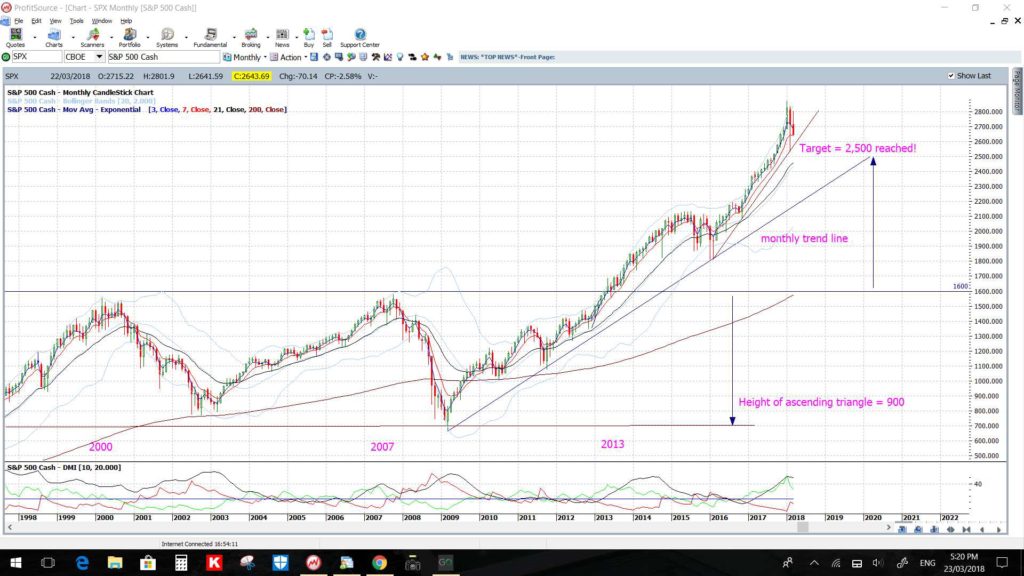
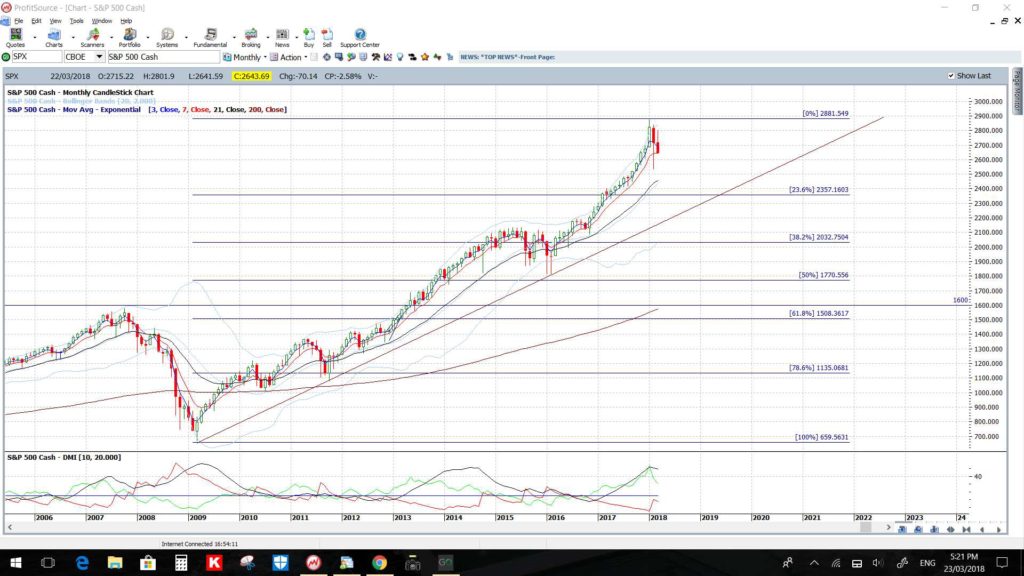
S&P500 monthly: this broad-based stock index has been in an uptrend since the GFC of 2008-2009. It broke up through the previous high, circa 1,600 in 2013 and has been plugging along since then. Note the bearish-reversal ‘Hanging Man’ that was printed in February and how the March candle is currently bearish too. Note, also, how the popular 61.8% Fibonacci retracement level for this post-GFC swing high move is down near the previous breakout level of 1,600. That is my worst-case scenario pullback target if things continue to stay ugly for stocks and market confidence.
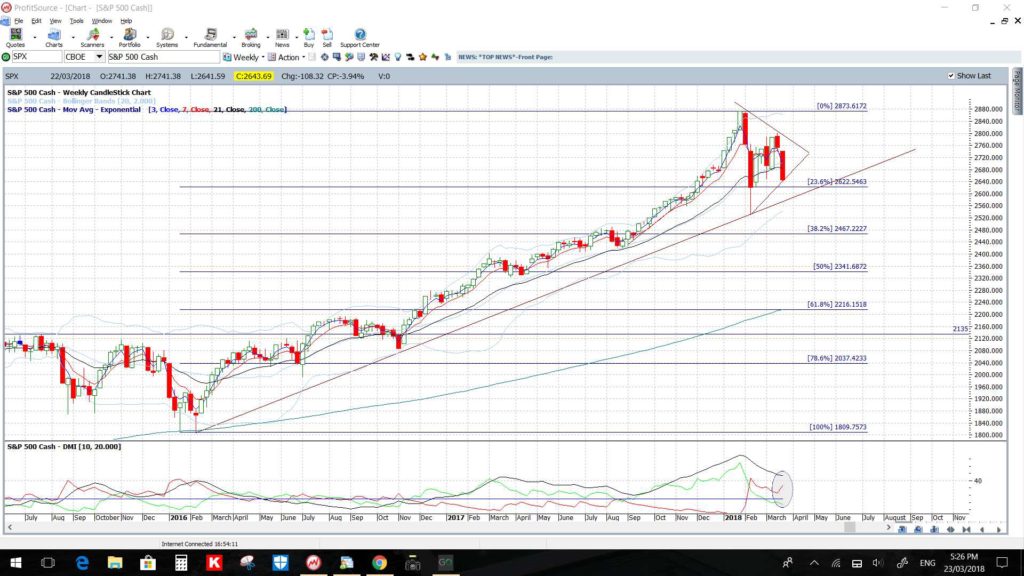
S&P500 weekly: the weekly chart shows the swing high move since 2016. The 61.8% Fib of this move is down near 2,135 which is a previous S/R level and congestion zone. Any bearish breakdown through this weekly support trend line would have me looking for a test of this S/R zone:
FANG: it is against this backdrop of an unrelenting uptrend since 2009 that I look to the illustrious FANG stocks, as they have enjoyed significant gains throughout that period. As with the S&P500 index though, whilst these stocks continue to hold above support trend lines, one wonders if they might be due a technical pullback? One thing is certain, trends don’t travel in straight lines forever and it is with this in mind that I look for potential pullback levels on these FANG stocks that might be targeted in any deeper correction-style move.
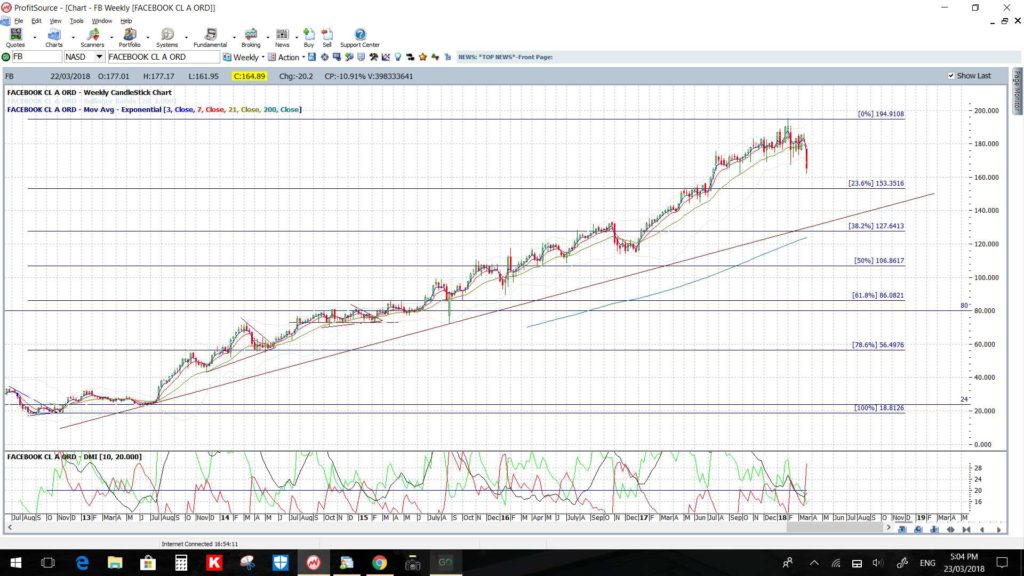
FB: Facebook weekly: FB remains above the weekly 200 EMA and above a weekly support trend line. Note how the 61.8% Fibonacci retracement for this swing high move is down near the previous congestion zone circa $80. This would be the target for any deeper correction-style pullback here if the support trend line is broken.
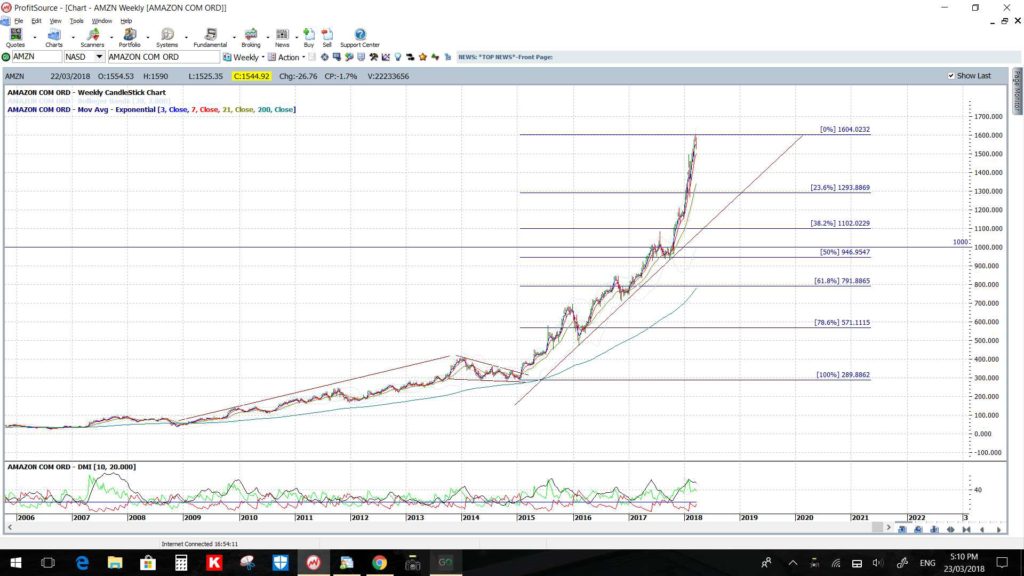
AMZN: Amazon weekly: AMZN has been experiencing exponential style growth over recent years. It also remains a long way above the weekly 200 EMA and above a weekly support trend line, as much as a straight line can be drawn here! Note how the 50% Fibonacci retracement for this swing high move is down near previous congestion zone near the whole-number and psychological $1,000 level. This would be the target for any deeper correction-style pullback here if the support trend line is broken.
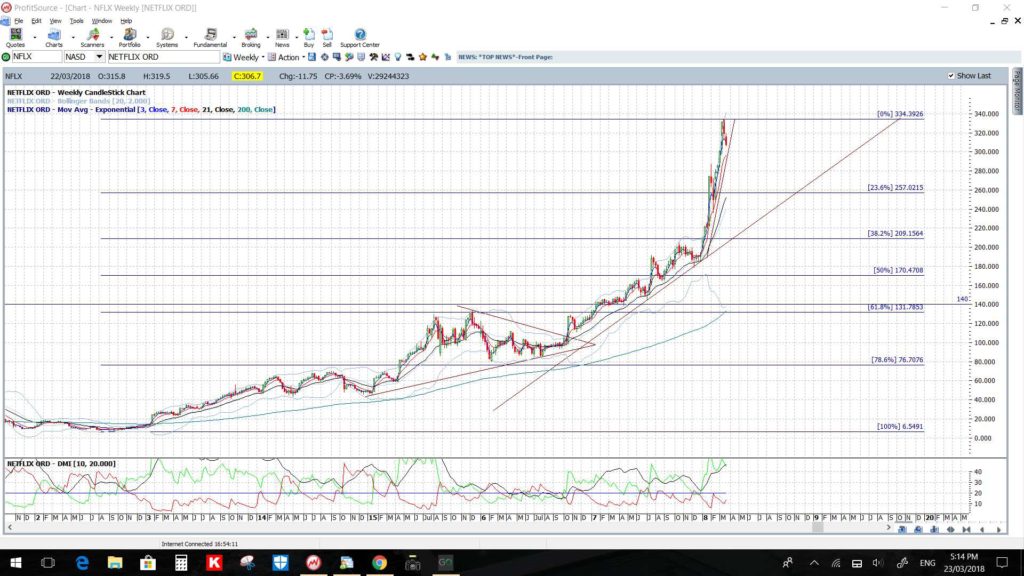
NFLX: Netflix weekly: NFLX iis a bit like Amazon with a more exponential style look to its chart. NFLX also remains above the weekly 200 EMA and above a weekly support trend line. Note how the 61.8% Fibonacci retracement for this swing high move is down near a previous S/R zone circa $140. This would be the target for any deeper correction-style pullback here if the support trend lines are broken.
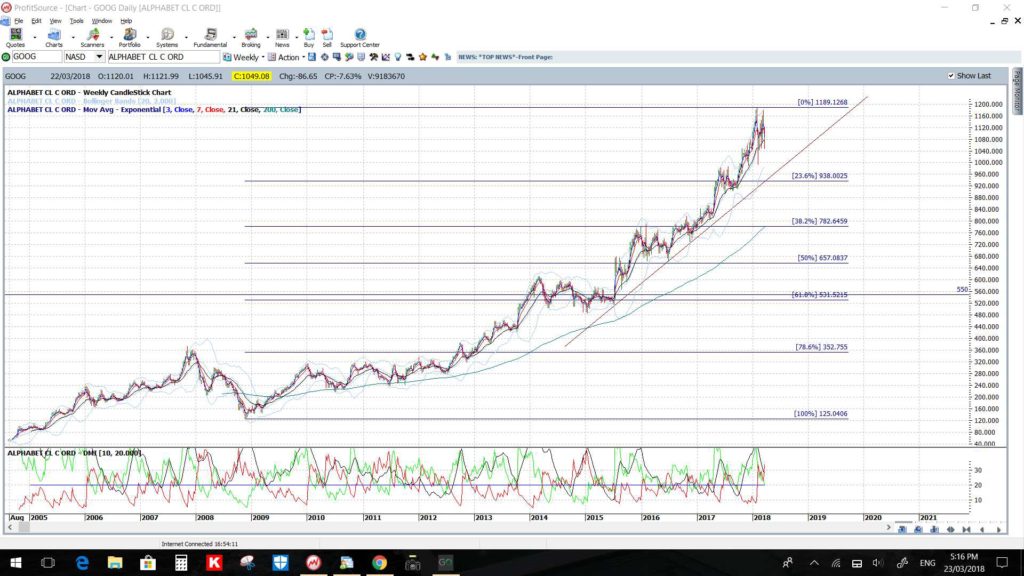
GOOG: Alphabet weekly: GOOG remains above the weekly 200 EMA and above a weekly support trend line as well. Note how the 61.8% Fibonacci retracement for this swing high move is down near previous congestion zone near $550. This would be the target for any deeper correction-style pullback here if the support trend line is broken.
Summary: The S&P500 index and FANG stocks have been in an uptrend since the 2009 GFC and, as such, a technical corrective move is not out of order. In this post I have identified major S/R levels for each of the S&P500 AND FANG stocks should their support trend line be broken. ThesE levels are:
- S&P500: 2,135 followed by 1,600
- FB: $80
- AMZN: $1,000
- NFLX: $140
- GOOG: $550


