I’ve been charting and posting about Bitcoin over recent months and suggesting that any hold above a key support level would help to carve out credibility for the cryptocurrency space. So far so good and here is a charting update following the bullish February candle close for Bitcoin.
In a recent article I recalled how I have been watching for two key events to unfold with Bitcoin price action that would lend technical credibility to the currency. These two events are:
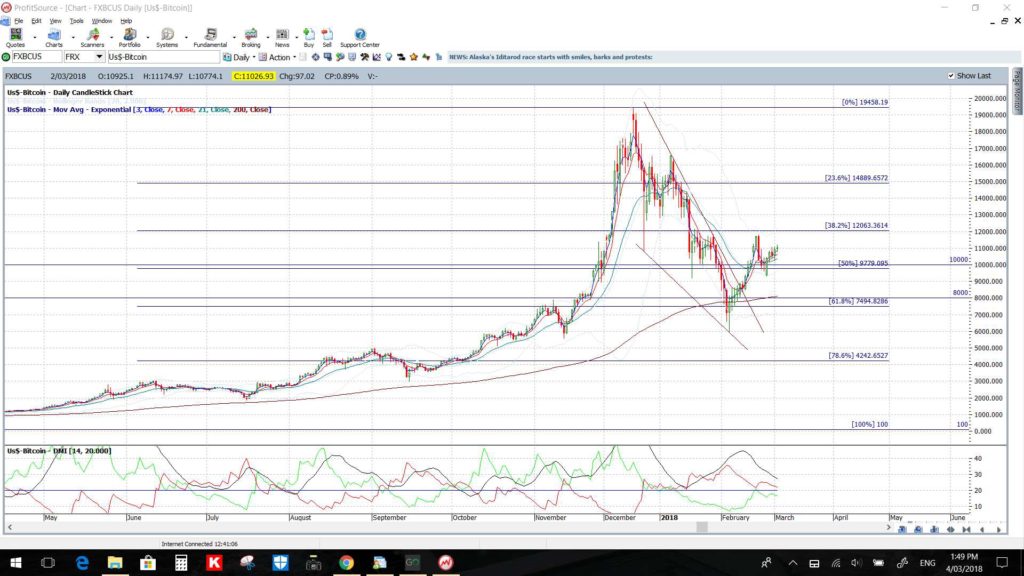
- A test of the weekly chart’s 61.8% Fibonacci level near $8,000.
- A hold above the weekly chart’s 61.8% Fibonacci level near $8,000.
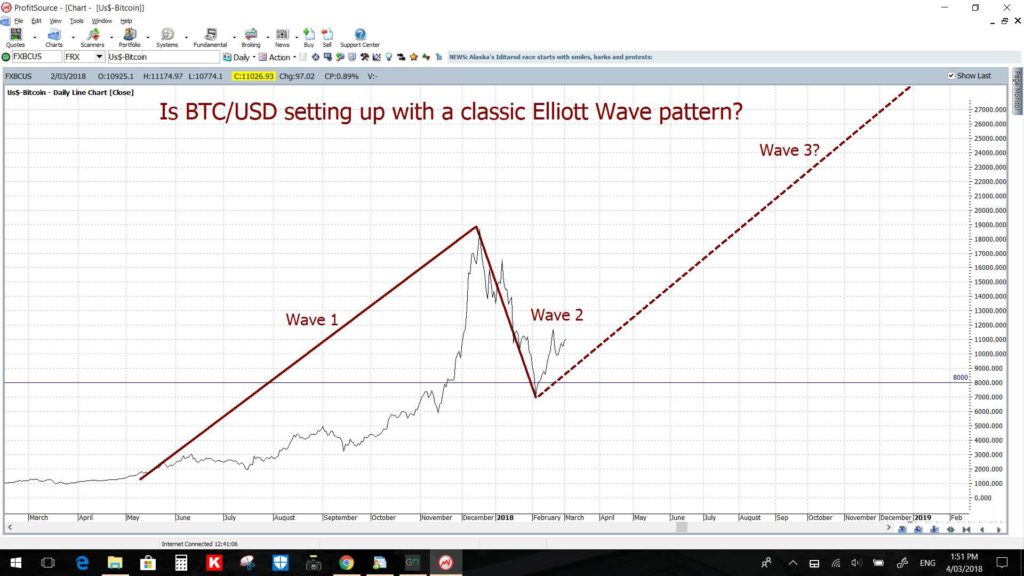
So far, both events have evolved and held and, thus, I’m watching to see if other technical features unfold on Bitcoin. The main one being any conformation to an Elliott Wave 3 style extension which would suggest potential for a run up to $50,000. All is explained again in the charts below.
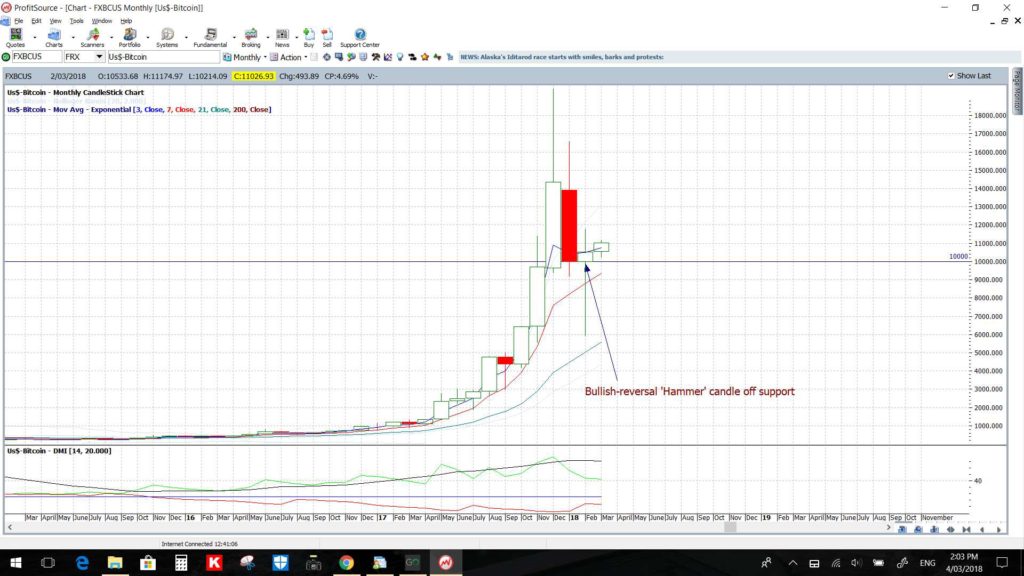
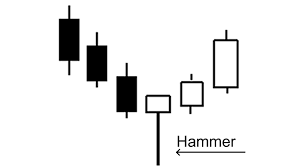
BTC/USD monthly: The February candle closed with a bullish-reversal ‘Hammer’ candle and the new March candle is bullish for now as well. Hammer candles hold greater significance when they form at a key S/R level and this candle formed at the major $10,000 region conferring extra value to this particular formation.
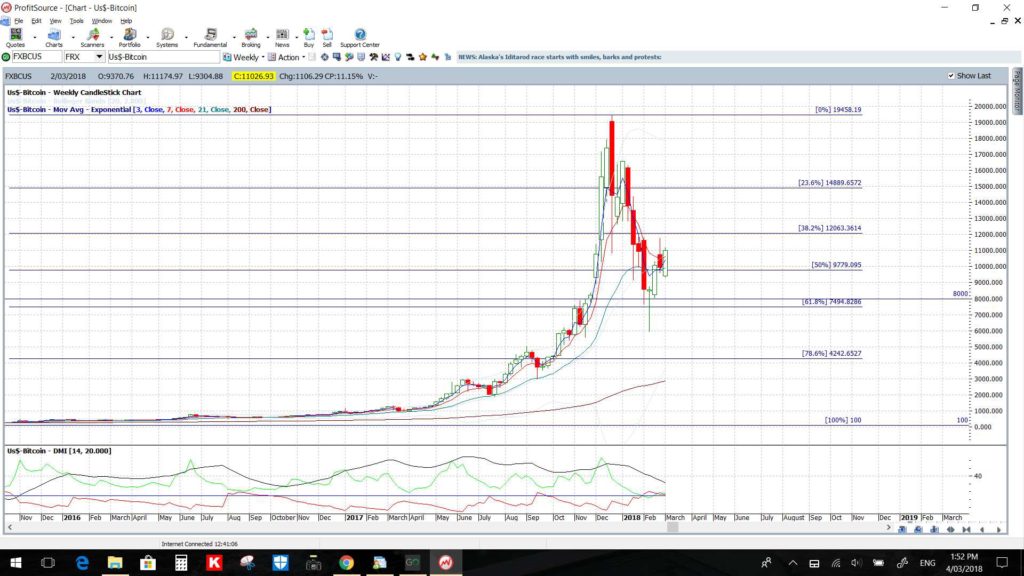
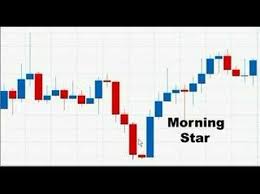
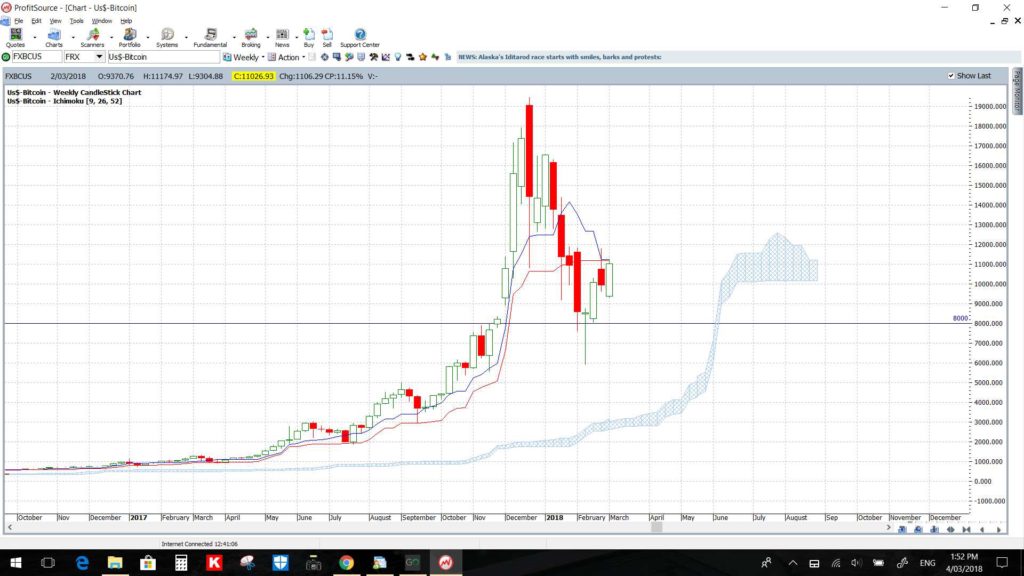
BTC/USD weekly: I had pointed out a bullish-reversal Hammer candle and the ‘Morning Star’ pattern in an article a couple of weeks ago and look how this was, indeed, a good predictor of price action! There was another bullish candle formed last week with a bullish-engulfing weekly candle and this closed above the next major whole number level of $11,000:
BTC/USD weekly Ichimoku Cloud: Note how price action had moved well away from the Cloud when it pushed up to the $20 K level. Some reversion to the mean was well in store and this has been achieved with the recent pullback:
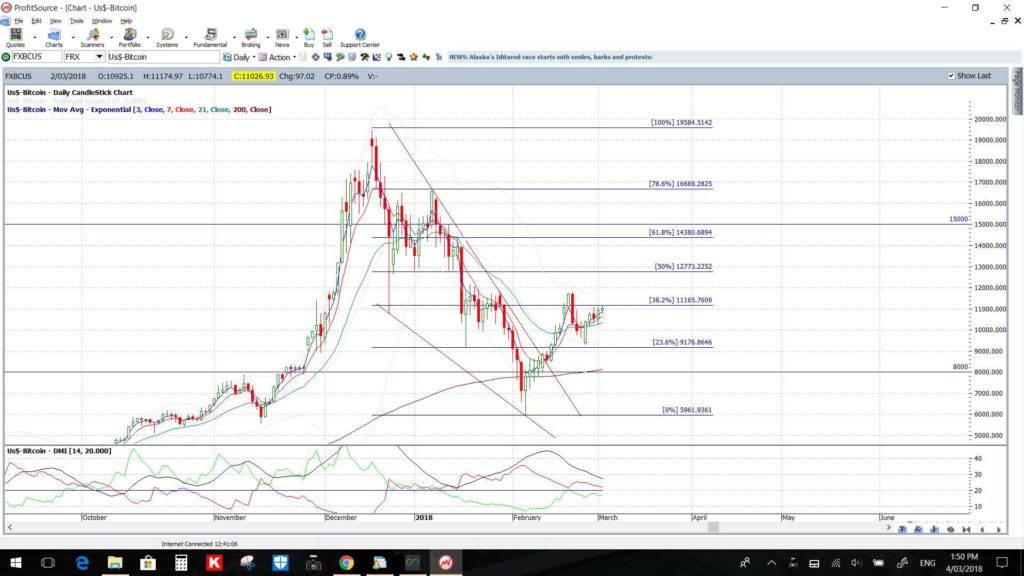
BTC/USD daily: So far, the bullish descending wedge breakout is on track after the hold above the 61.8% fib of the long-term swing high move:
BTC/USD daily with Elliott Wave: The hold above the $8,000 level is setting up for a potential Wave 3 move in Elliott Wave style.
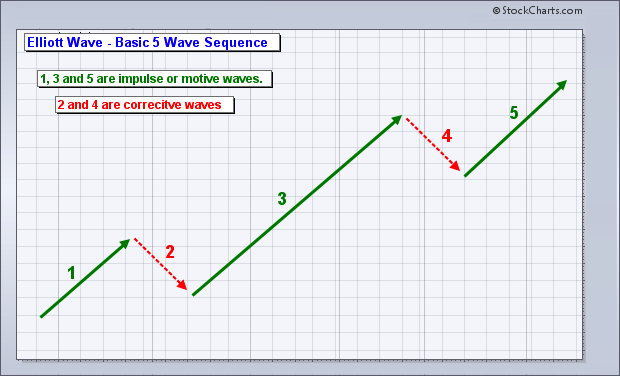
Recall that Wave 3 moves are the longest of the Elliott Wave moves as shown in this summary diagram below:
BTC/USD daily Elliott Wave Retracement: In looking for potential bullish targets I first start by placing the Fibonacci retracement tool on the most recent swing low move. Doing so reveals that the 61.8% fib level is up near $15,000 and so that would be the first major target in any continued recovery here. The next level in focus would be the previous High near the $20,000 whole-number and psychological level:
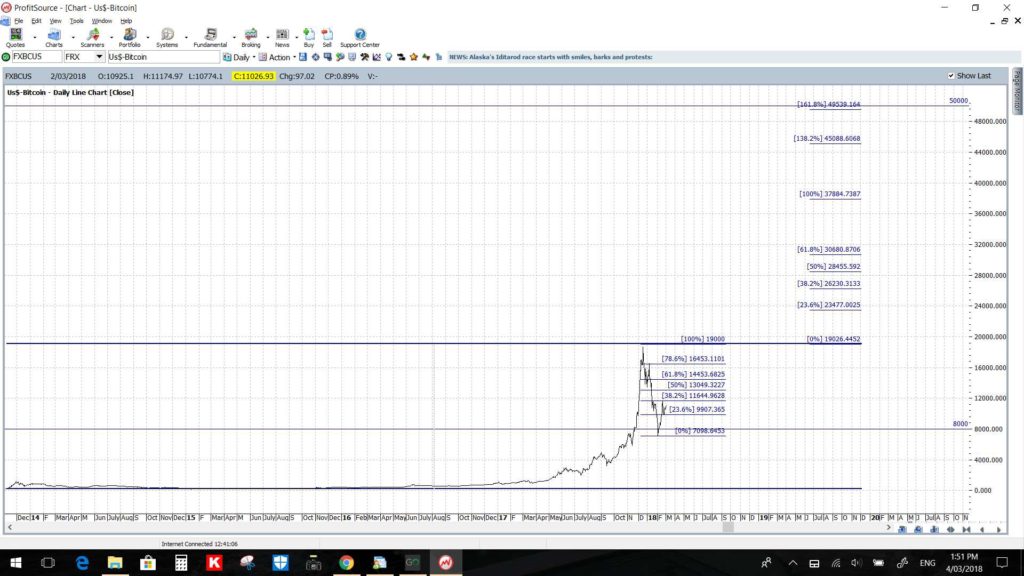
BTC/USD daily: Elliott Wave Extension: The next step in looking for bullish targets beyond $20,000 is to add an Elliott Wave Extension tool to price action. This tool shows that key Fibonacci levels tie in with significant whole-numbers levels and these targets would move into focus on any push back above the last swing High move of $20,000:
- the 61.8% fib extension is near the $30,000 whole number level.
- the 100% fib extension is near the $40,000 whole number level.
- the 161.8% fib extension is near the $50,000 whole number level.
Summary: Bitcoin continues to hold above the weekly chart’s 61.8% fib level of $8,000 and has now made a close above $11,000. The $10,000 whole-number level remains the one to monitor in coming sessions but any continuation higher form here will support my thesis that Bitcoin could be embarking on an Elliott Wave 3-style bullish move. The longer Bitcoin holds above $10,000, and moves higher, then the greater credibility this currency garners as being an instrument that conforms to accepted technical charting analysis!
Targets: Continuation above $10,000 will bring the following levels into focus as potential bullish targets:
- $15,000: being the 61.8% fib of the recent swing low move.
- $20,000: being the recent previous High.
- $30,000 being the 61.8% fib extension.
- $40,000 being the 100% fib extension.
- $50,000 being the 161.8% fib extension.
NB: I am aware that BTC/USD trades 24/7 but it useful to designate a daily, weekly and monthly close to enable charting analysis.


